The U.S. stock market is overdue for a significant correction. The GDPNow forecasting model of the Federal Reserve Bank of Atlanta estimates that U.S. GDP growth has turned negative. When the economy sputters, corporate profits evaporate, and the stock market implodes.
My forecasting models currently expect problems with the stock market to hit somewhere between April and July. (They see a minor downturn, but nothing spectacular.) I expect a sharper decline a bit earlier, in March or April triggered by Washington craziness.
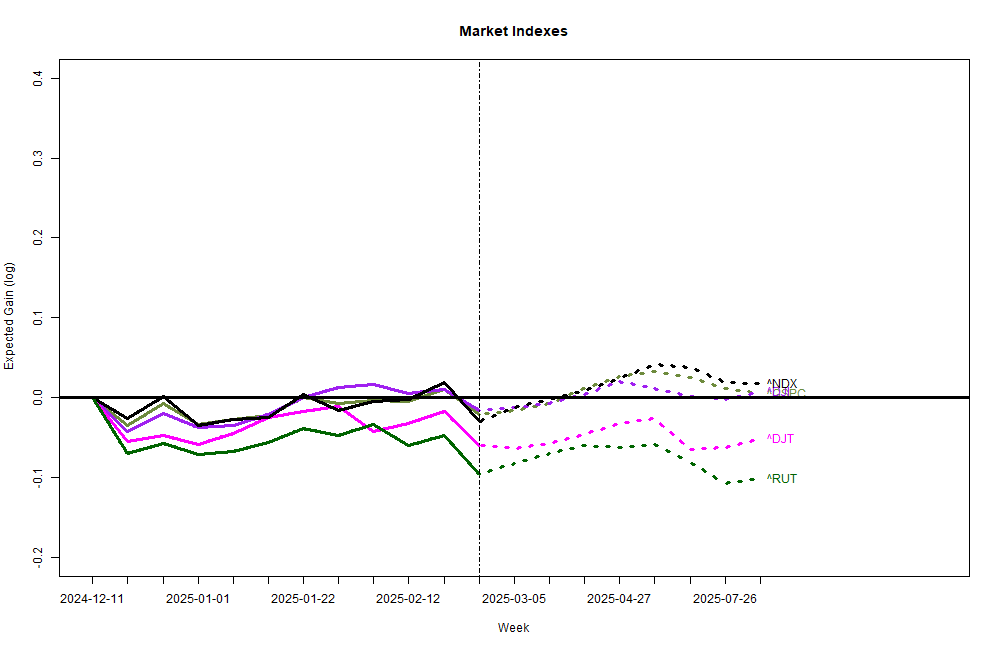
I curate many stock valuation models these days. Though all are based on macroeconomic data, they don’t fully agree; each considers somewhat different economic data sets. Collectively, the models are now more negative than positive. With my newer models, 1-month and 2-month forecasts are mildly positive (see chart above), but the 6-month forecasts are flat at best. My older models that have been running since 2007 expect a 6% loss over the next 6 months. A number of models in both the new and old forecast series collectively see the probability of gain for the next 6 months as 0.2 to 0.5 — that is way below the average probability of gain as about 0.75. So, collectively, these forecasting models say the stock market is about to roll over.
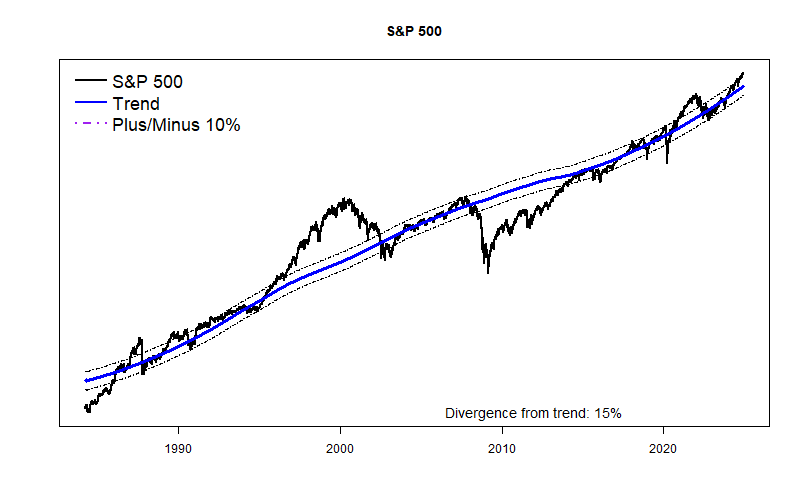
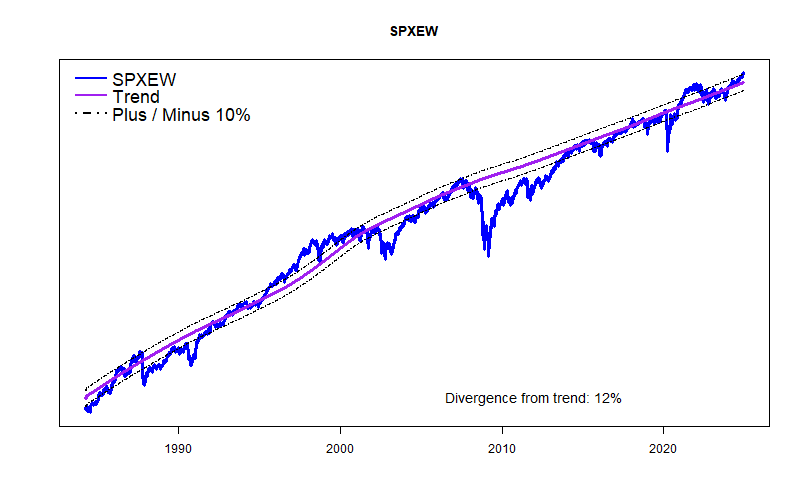
As I have written many times, these models don’t read the newspaper. They see weakness coming because the economy has been overstimulated, price/earning multiples are unsustainable, and leading economic indicators are starting to weaken slightly.
I live in Washington, DC and cannot avoid reading the newspapers. I see several ways the economy can be damaged in the near term. Some of this damage certainly will occur.
Reduced government spending: -1% of GDP A wild guess. The speed at which Trump and Musk have curtailed government spending has been breathtaking. I live in the eye of the storm and do not have a clear view of things. Too many people I know have lost their jobs or fear that they may be out of work soon. With many legal actions pending and the Trump administration just getting going, I doubt that a clear accounting is possible yet. So, it is just a wild guess that all the budget cutting will hit GDP by 1%. (Their goal is actually higher than this.) More likely GDP could drop something like 3% because of the multiplier effect of government deficit spending, disruption losses, malaise and fears. On the positive side, lower government spending can lead to lower taxes and therefore help both individuals and business — but these benefits will not kick in until 2026 at the earliest. The pain comes long before any gains. Will the spending cuts evaporate? Maybe.
Increased tariffs: -1% of GDP Another wild guess, but there have been estimates that the average American will incur roughly $1,200 in additional costs because of the China, Canada, and Mexico tariffs. Trump has referred many times to additional tariffs as well that would up the ante. There certainly will be increases in U.S. production due to the protections offered by the tariffs — But, any economic benefits will not occur for months of years — it takes time to build new factories, hire and train workers, and create new supply chains. The pain (probably mainly in the form of inflation) will come long before any potential gains. Will the tariffs evaporate? Maybe.
Cryptocurrency crash: -1% of GDP Just a guess. The underlying justification for these assets is that they cannot be affected by, or traced by government. Therefore they are the perfect way to hide illegal activity. I had my first experience with what is called The Intelligence Community in 1994. I have great faith that the Intelligence Community can track crypto just as much as it wants. Cryptocurrency is a bubble that will have a sudden and unpleasant explosion. I have no idea when the bubble will burst, but when multiple economic bubbles exist like now, they tend to pop at the same time.
Government shutdown: -1% of GDP Another wild guess since it might not even happen. On March 14, federal budget authorization expires and a partial government shutdown will begin unless Congress acts first. Though the House of Representatives have passed a budget outline, the details of any actual legislation are weeks away. Passage of the largest budget cuts such as for Medicaid is questionable. A Continuing Resolution (CR) to authorize spending at current levels until September 30 is the temporary solution that Republican leadership and the President want. The problem is that a number of Republican House members usually vote against any CR’s. And Democrats are unlikely to support a CR unless there is some sort of guarantee that the Trump regime will actually adhere to spending legislation rather than cutting spending at will. Thus, a confrontation and government shutdown is highly likely. The real question is how long it will last. President Trump created the government shutdown record of 35 days in his last term. Here the pain is highly likely and there is no real gain possible. Will the shutdown be avoided or curtailed quickly. Don’t know.
A Recession is zero net GDP gain and a 2% drop is enough to be called a Depression I have not seen a credible estimate of all the economic uncertainties of the moment, but they are both significant and real. Famously, Saul Samuelson quipped in 1982 that the stock market has predicted 9 of the last 5 recessions. That could easily happen again in a couple of weeks. Or not.


