In 2 days the Trump government says it will announce a comprehensive package of trade tariffs. These taxes will be imposed on top of the recently adopted 25% tax on imported automobiles and components, steel and aluminum tariff increases, and additional tariffs on products from China. This will be a surprise announcement — the Trump White House typically leaks information like a sieve, but this time the leaks are so confusing and contradictory that they effectively have been equivalent to a full news black out. The most quoted insider statement is that they are hoping to gain $6 trillion in tariff revenue over the next decade — $600 billion per year. A hundred billion dollars here, a hundred billion there, and sooner or later you are starting to talk about real money.
My opinions on this exploding Trade War don’t count. No one cares about my opinions, nor should they as I am not an economist, let alone one with extensive knowledge of international trade. Economics 101, however, told me that when “Trade War” is capitalized it is not a good thing.
What this blog does is to document how well my macroeconomic statistical forecasting approach succeeds in forecasting US stock market prices in time spans from 1 week to 6 months.
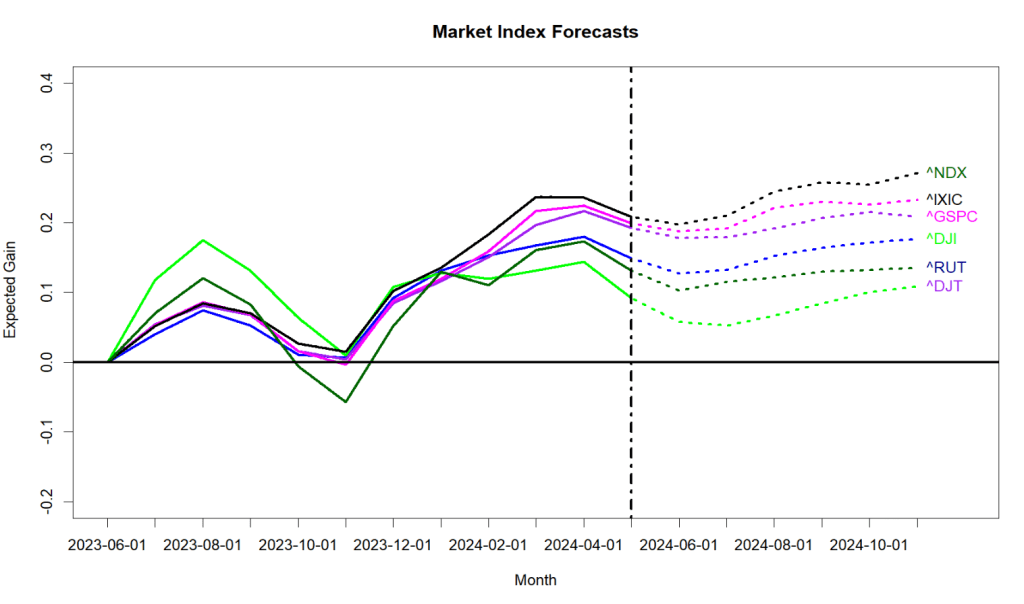
My forecasts are largely blind to what is coming. The monthly forecasting approach that I have been reporting on for 17 years sees a subdued next half-year. We have been inching toward a recession for quite some time. The probability of at least breaking even over the next 6 months is roughly 45% to 60%, definitely below the normal 70% to 85% likelihood. The predicted 6-month gains average at a below-normal 2% gain, but the swarming models range from -2% to +7%. The 1-month models are all positive, but slightly below average. I will report on my more advanced daily forecasting methods in a couple of days, after the tariff announcements, but their current numbers are comparable to the long-standing monthly models.
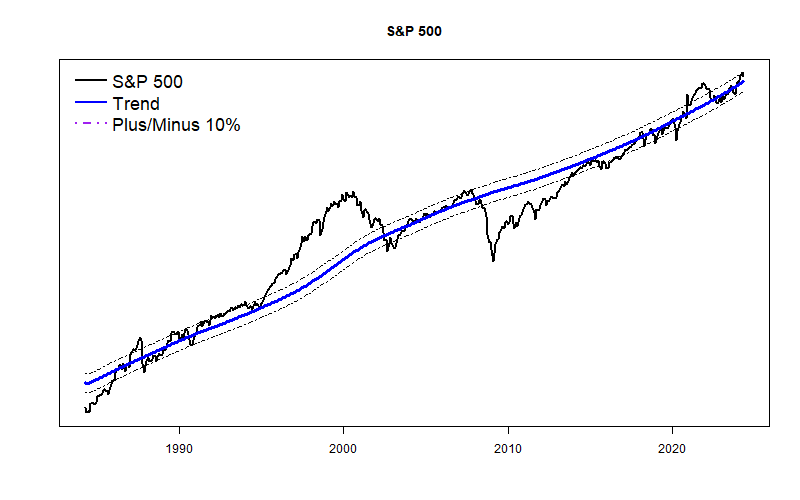
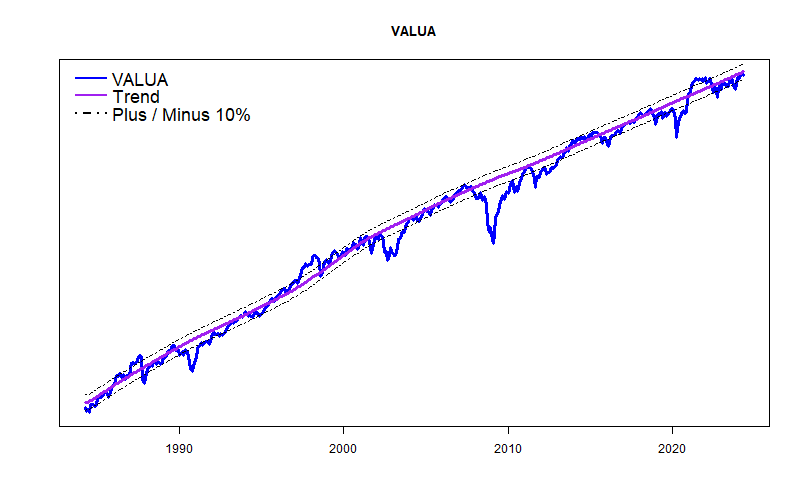
Last month’s sharp stock market decline puts the S&P 500 price almost exactly at my long-term price trend line, and the equal-weight Value Line Arithmetic Average is about 8% BELOW trend. So, unlike a few months ago, stocks now “have room” to move either up or down. That’s a good thing, but does nothing to suggest what happens next.
The U.S. stock market is overdue for a significant correction. The GDPNow forecasting model of the Federal Reserve Bank of Atlanta estimates that U.S. GDP growth has turned negative. When the economy sputters, corporate profits evaporate, and the stock market implodes.
My forecasting models currently expect problems with the stock market to hit somewhere between April and July. (They see a minor downturn, but nothing spectacular.) I expect a sharper decline a bit earlier, in March or April triggered by Washington craziness.
I curate many stock valuation models these days. Though all are based on macroeconomic data, they don’t fully agree; each considers somewhat different economic data sets. Collectively, the models are now more negative than positive. With my newer models, 1-month and 2-month forecasts are mildly positive (see chart above), but the 6-month forecasts are flat at best. My older models that have been running since 2007 expect a 6% loss over the next 6 months. A number of models in both the new and old forecast series collectively see the probability of gain for the next 6 months as 0.2 to 0.5 — that is way below the average probability of gain as about 0.75. So, collectively, these forecasting models say the stock market is about to roll over.
As I have written many times, these models don’t read the newspaper. They see weakness coming because the economy has been overstimulated, price/earning multiples are unsustainable, and leading economic indicators are starting to weaken slightly.
I live in Washington, DC and cannot avoid reading the newspapers. I see several ways the economy can be damaged in the near term. Some of this damage certainly will occur.
Reduced government spending: -1% of GDP A wild guess. The speed at which Trump and Musk have curtailed government spending has been breathtaking. I live in the eye of the storm and do not have a clear view of things. Too many people I know have lost their jobs or fear that they may be out of work soon. With many legal actions pending and the Trump administration just getting going, I doubt that a clear accounting is possible yet. So, it is just a wild guess that all the budget cutting will hit GDP by 1%. (Their goal is actually higher than this.) More likely GDP could drop something like 3% because of the multiplier effect of government deficit spending, disruption losses, malaise and fears. On the positive side, lower government spending can lead to lower taxes and therefore help both individuals and business — but these benefits will not kick in until 2026 at the earliest. The pain comes long before any gains. Will the spending cuts evaporate? Maybe.
Increased tariffs: -1% of GDP Another wild guess, but there have been estimates that the average American will incur roughly $1,200 in additional costs because of the China, Canada, and Mexico tariffs. Trump has referred many times to additional tariffs as well that would up the ante. There certainly will be increases in U.S. production due to the protections offered by the tariffs — But, any economic benefits will not occur for months of years — it takes time to build new factories, hire and train workers, and create new supply chains. The pain (probably mainly in the form of inflation) will come long before any potential gains. Will the tariffs evaporate? Maybe.
Cryptocurrency crash: -1% of GDP Just a guess. The underlying justification for these assets is that they cannot be affected by, or traced by government. Therefore they are the perfect way to hide illegal activity. I had my first experience with what is called The Intelligence Community in 1994. I have great faith that the Intelligence Community can track crypto just as much as it wants. Cryptocurrency is a bubble that will have a sudden and unpleasant explosion. I have no idea when the bubble will burst, but when multiple economic bubbles exist like now, they tend to pop at the same time.
Government shutdown: -1% of GDP Another wild guess since it might not even happen. On March 14, federal budget authorization expires and a partial government shutdown will begin unless Congress acts first. Though the House of Representatives have passed a budget outline, the details of any actual legislation are weeks away. Passage of the largest budget cuts such as for Medicaid is questionable. A Continuing Resolution (CR) to authorize spending at current levels until September 30 is the temporary solution that Republican leadership and the President want. The problem is that a number of Republican House members usually vote against any CR’s. And Democrats are unlikely to support a CR unless there is some sort of guarantee that the Trump regime will actually adhere to spending legislation rather than cutting spending at will. Thus, a confrontation and government shutdown is highly likely. The real question is how long it will last. President Trump created the government shutdown record of 35 days in his last term. Here the pain is highly likely and there is no real gain possible. Will the shutdown be avoided or curtailed quickly. Don’t know.
A Recession is zero net GDP gain and a 2% drop is enough to be called a Depression I have not seen a credible estimate of all the economic uncertainties of the moment, but they are both significant and real. Famously, Saul Samuelson quipped in 1982 that the stock market has predicted 9 of the last 5 recessions. That could easily happen again in a couple of weeks. Or not.
My forecasting models have started to twitch nervously, even though they still cannot read the newspaper. Overall, the models look at a significant array of economic data and conclude that the corporate economic environment is really pretty good. GDP is above trend. Profits are wonderful. The Federal Reserve is tightening less and less. Chances for a recession very soon are miniscule. All good. Unfortunately, stock prices generally are way above normal — historically above normal. Sooner or later something is going to break, with the question being: When? The exact “Why?” may be becoming clear.
My older econometric forecast formulas (followed since 2007, R.sq ~ 0.5) are turning somewhat pessimistic for the coming half year with an expected SP500 loss of roughly 4%. The 6-month probability of loss is slightly higher than the probability of gain. The newer forecasts (graph above) are based on much more data and “should” be more accurate. Just like last month, the newer forecasting models are a bit more positive than my older models with the SP500 gaining a bit for the next two months, but then falling so that the index is essentially flat by the end of July. Both sets of models are starting to fret a bit about late spring.
In my view, the new Trump-2 administration is trying to avoid having the US economy crushed between a proverbial rock and a hard place. The clash is not easily avoidable.
The crushing “rock” in the analogy is the US Federal Deficit. At 6.3% of GDP the current federal deficit is at an unsustainable level characteristic of economic emergencies. Usually, this level of deficit occurs when GDP is down (recession) and Federal recovery spending is way up, and it corrects naturally and quickly when the economy recovers and emergency Federal spending runs out. That is not the case today; GDP is already unusually high and most Federal stimulus spending has already run out. The crushing deficit today is structural, not temporary, and stems from entitlement programs (Medicare, Social Security) and the Trump tax cuts of 2017 that are expiring this year. If the tax cuts are not renewed, the deficit will quickly move toward normal. But, that probably won’t happen.
The “hard place” stems from Mr. Trump promising to renew the tax cuts and even increase them, adding further reduction in corporate taxes, lower taxes on social security earnings, increased State and local tax deductions, no tax on tip income, etc. He also has promised to leave Medicare and Social Security programs untouched.
The President has made clear that he intends to escape the deficit bind through drastically reduced federal spending and massive tariff increases. As he has said of the tariffs: “It’ll be a tremendous amount of money for our country, tremendous amount.”, also: “Tariffs are going to make us very rich and very strong.” So far, he has presented only a general sketch of his plans.
Supposedly, 25% tariffs on Canada and Mexico begin today, as I write. On the federal spending side, last week, there was a pause in nearly all federal grant programs and roughly a million federal employees received an email encouraging them to resign with the bonus of 6 months of administrative leave (or face unpleasant working conditions). There appears to be no legal authorization for either initiatives.
As of last Friday, the stock and bond markets appears to have ignored all the fireworks. I have a strong feeling that is going to change. For this spring, I expect a period of high volatility as world markets try to understand what is actually happening.
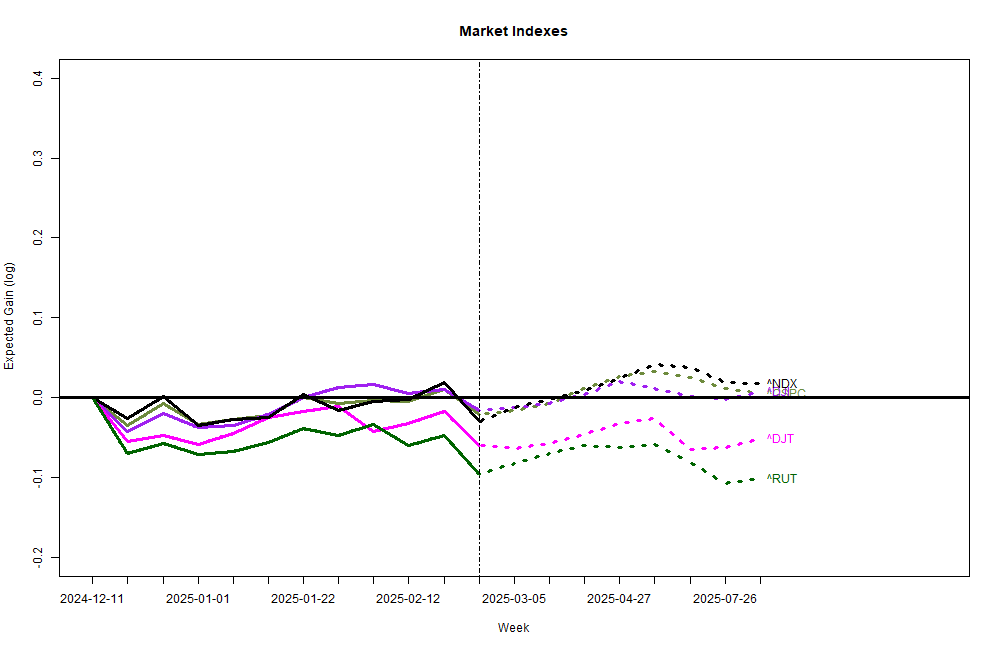
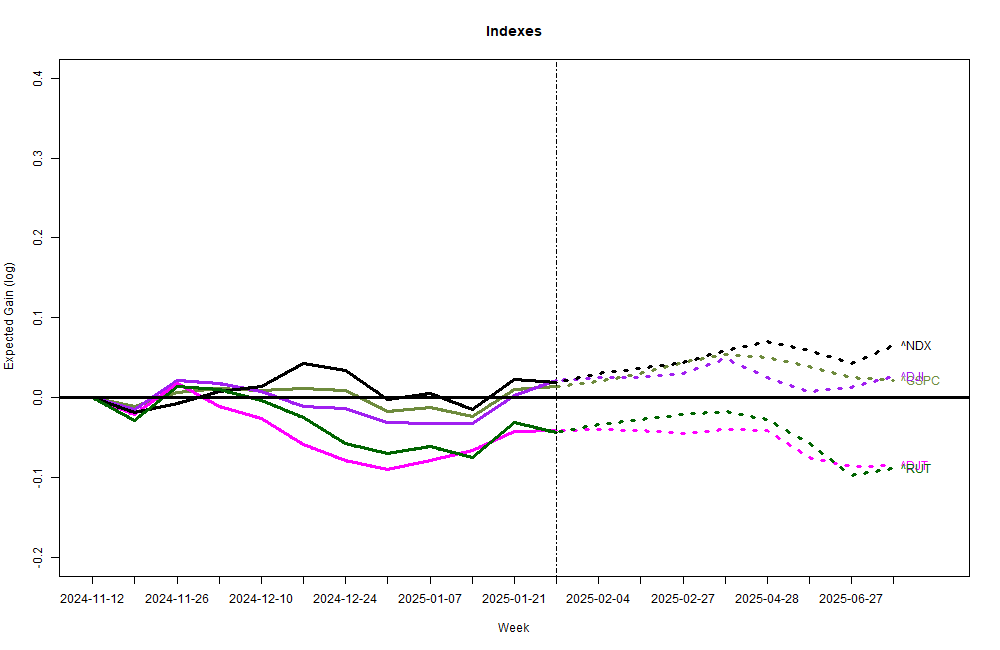
My models for various US stock market indexes are surprisingly positive for the first half of 2025: flat to negative for January, but then generally rising over the next 6 months. The forecast for the NASDAQ 100 ( ^NDX) is strong. My older monthly-based models for the S&P 500 and the ValueLine Arithmetic Average are not as encouraging, just flat for the coming half year.
The models reflect a strong macroeconomic picture. Gross Domestic Product is robust, running about 2% above the Real Potential GDP model maintained by the Congressional Budget Office. Inflation for consumers and industrial commodities is down, so the Federal Reserve has shifted from trying to restrain the economy to a more neutral stance. Interest rates are high-ish compared to the past half-decade, but rates are modest compared to the past half-century. Crucially, long-term interest rates have finally climbed above short-term rates; that is a good thing as it gives the financial sector room to breathe. Money supply if easing a bit; that’s always nice. Corporate profits remain strong. Several indicators say prospects for a near-term recession are minimal. Unemployment at 4.1% has crept up slightly, but is historically good. We are on the leading edge of major technological change through Artificial Intelligence, and already there are huge new capital investments underway with prospects for more to come. The stock market has scored up the best two-year returns since 1998! What’s not to like?
Unfortunately there are three problems that eventually will slam the stock market. The only real question is: When?
First, the US economy is only glowing brightly because of huge and unsustainable federal government budget deficits, not mainly through real intrinsic growth. Second, even if the economy was not propped up unrealistically, the market is still way over-priced by nearly all traditional valuation measures. Third, all other industrialized countries are going through the same process of cutting covid-related government deficits. Already, the parliaments of Germany, France and South Korea have fallen because there were no agreements on budgets going forward. Bond markets are starting to worry.
And, it is totally unclear what the U.S. Congress is going to do about the budget this spring. Will the deficit shrink or will it explode in size? Unknown. Aside from that, everything is great, and it doesn’t seem like the world is ready to explode this month.
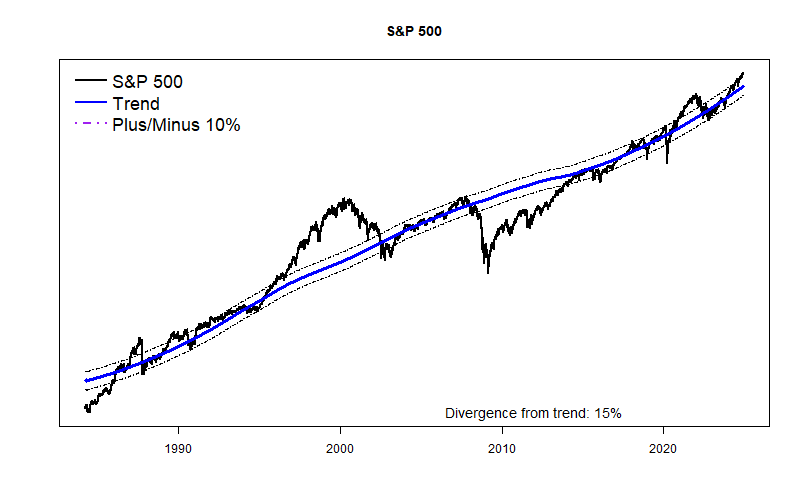
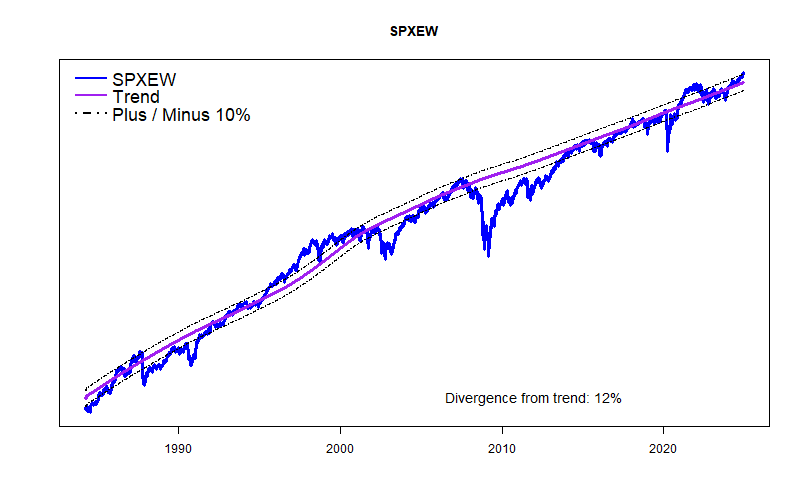
I recalibrated my long-term trendlines for the S&P 500 and the Equal Weight S&P 500. The recalibration better recognizes the impacts of inflation on the market. The modified trendlines have a slightly better fit with the past 4 decades of market behavior. The good news is that according to the new trend lines the S&P 500 is somewhat nearer to trend and the Equal Weight S&P 500 is actually slightly below trend.
(For the next year or so I will report on two sets of market forecasts. I will keep up my monthly forecasting models which I have documented for about 17 years. I will also be reporting monthly on newer market forecasting models that create forecasts on a daily basis. These newer models, however, have only about a year of forward-testing. I apologize in advance to both of my readers for confused reporting on the two sets of analyses.)
My original forecasting equations originating in 2007 are somewhat negative for the US stock market for the first half of 2025. My newer, much more data-intensive forecasts are mildly positive for the next 6 months. The difference isn’t huge, but it is real.
The stock market has been making new highs, climbing the Wall of Worry, and is historically overpriced. In the near term, stocks have plenty of room to fall down, but little chance of quickly falling up. Given those caveats, my forecasts for the near future are mildly positive.
My long term trend models for the US stock market keep showing a developing price bubble. The S&P 500 is 15% above trend and the equal-weighted version of the S&P is 12% above trend. This bubble will probably keep growing. The bubble is still minor in comparison to the Dot-Com Bubble before 2000.
The Federal Reserve has begun to reduce short term rates, but the high level of short-term rates compared to long-term interest rates is still a very real negative factor in finance. Banks can’t make money lending money for long terms if they need to pay very much for short-term funds. They are painfully squeezed and have only been saved through Federal Reserve intervention.
On the other hand, truly massive Federal deficit spending — currently 6.11 percent of GDP — is dominating the economic situation. For comparison purposes, the total economic contribution of ALL FARMING to GDP is less than 1% of GDP ( 0.7%). Including all agriculture, food, and related industries takes the share up to just 5.6% of GDP. So, the US current deficit of greater than the economic impact of all the food we consume — all the food, supermarkets, restaurants, warehouses, even the Taco Bells! That is an incredibly high level of splurge spending that has only occurred during major national emergencies. It is not sustainable.
This spring the new administration and the new Congress will begin to deal with the deficit situation. It will either get better or get worse. (If you think the deficit will improve significantly, I’d like you to consider buying a nice bridge I recently obtained in Brooklyn.) Recent increases in long-term interest rates show that Big Money expects the deficit to get worse. In that case the stock market’s developing Bubble will expand. The math is pretty simple.
I am especially thankful that none of my forecasting models can read the newspaper, or even know what I think.
The only things the models know are long established reputable economic data series. Each data set has been publicly available for at least 10 years; most have at least 3 decades of experience. A few go back much further. Each variable has a proven statistical relationship to at least some stock market prices. (Mimimum 95% confidence level.) Nearly two decades ago the models started with about a dozen key economic variables, but now roughly 4 dozen macroeconomic variables are included along with millions of data elements from individual stocks. Variables still are almost entirely focused on the US stock market. Things started with a single macro model that went unchanged for years. Now there is an AI swarm of thousands of models, each with a slightly different point of view, and each having to prove its current value and accuracy profile. Each model gets refined on a weekly basis. Every forecast for any stock results from a minimum of 30 independent analyses.
I started these stock forecasting models because I was absolutely horrible at picking and timing stock purchases. My heart, emotions and hunches always got the best of me. Partly for that reason, there are no parts of the models that include my own expectations (like on interest rates or corporate profits in the coming month). Very pointedly, however, I do include a number of variables that do have a high ’emotional’ quotient. The VIX market ‘fear gage’ is one example. Numerous long-standing surveys make the cut as well.
My point in saying all of this is that over the next year or so it seems highly likely that individual stocks and the stock market will have an unusually high level of uncertainty. The stock market DOES read the newspaper and dwells on rumors and false trends. I expect to see unusually high volatility. Should that occur, the models reported on here will almost certainly predict a reversion back toward trend.
In the end, I trust the stock market will usually do what it usually does in response to changing economic circumstances. That’s what it has done for the past 17 years, at least. Who knows, maybe all of that will change, and pigs can start to fly. Perhaps, but I have no evidence of that.
We are in the early stage of what promises to be a major US stock market bubble. This is unlikely to be especially high and sustained real economic growth, just pure bubble. And it could last for a couple of years.
Last month these forecasts expected “the primary market indexes to pause and then retrace a bit”. Well, they did, but I grant that they went down more than a tiny bit. Anyway, the current forecasts expect the downward trend to continue for the next month or two. Nothing really major, but highly likely the market will drop some more. (Why? The equations say to blame the 1/2% increase in the 10-year Treasury rate.)
Last month the forecast for the S&P 500 was less than 1/2 of one percent positive. (Sub-Meh) But, it was POSITIVE, and for the last several months the market has been behaving above expectations. Now the tide has shifted and all the major indexes have projected 1-month losses of -1% to -3%. Does not look horribly bad, but the immediate expectation is now negative, and for the broader market the 6 month forecast is negative. The old adage “Sell in May…” looks like a winner this year.
I have a new graph to unveil. Of the 600+ large-cap stocks I follow, I keep score of the number that have strong positive 1-month forecasts versus the number with strong negative 1-month forecasts. This next graph shows the “bouncing-ball” output. The blue line is the net positive/negative score and the red line plots what actually happened to the S&P 500 for these months. (Ignore the last red month, it hasn’t happened yet.) Anyway, the net forecast is for a negative period that plays out something like last October-November.
Otherwise, nothing is seriously wrong with the stock market. The S&P 500 is bouncing along its normal boundary, busily deciding if it wants to begin a new and wonderful “AI Bubble”. (My hunch is that it will.) The more staid VALUE LINE Arithmetic Average is right at its long term trend line.


