I really don’t want to be alarmist, but things in the stock market could get much worse. 40% further decline? 60% more?
My stock market forecasts rely on gobs of tremendously boring data on a wide range of economic fundamentals. Usually economic fundamentals don’t shift instantly, nor do comprehensive data compilations such as for Gross Domestic Product or inflation. Most of the data I use is issued monthly or even quarterly. It is always somewhat out of date, and I just make adjustments.
Trump’s tariff announcements DID spin the economic world on a dime. My current data instantly became bogus. Suddenly ,the world economy is facing a dramatically different trade picture that threatens many countries with recession, or worse. Prior to the tariff announcements the US was already slowly sliding into recession. Now a US recession is highly likely according to more and more forecasters.
So, I shifted my forecasting process around to be able to ask it “What if?” questions, as in “What if the US was highly likely to be in recession next quarter, and certain to be in recession by September?” “What if oil prices continued to plummet down to $50 per barrel?”
Based on my entire existing database, what usually happens if the world economic order goes really out of whack is horrific. The S&P 500 6 month forecast would be an additional 40% loss and the worst probably 6 month loss could be 75% to 85%.
These are not hard and firm forecasts. No way. I only looked at a few possible alternatives. But, based on decades of stock market experience this is most probably how the market would perform. What we are facing now is a mild form of what did hit the stock market when Covid first spread.
The only thing that is certain is that more bad economic news should be expected and any positive news would be a major surprise.
The statistical stock market performance models I report on here have done pretty well since 2007 forecasting normal market activity, but they cannot predict the unpredictable. The models forecast what the stock market usually does in situations when usual market factors operate. In no world is the instant imposition of massive market tariffs “usual”. In fact, a good test of when things return to something like normal will be when these market forecasts become accurate again. That is months away.
In the meantime, there are some guesses that seem to make sense.
Trump cannot back down, at least not until the next round of tax cuts has been approved. The tariff program is central to the Trump push to keep income taxes low and to further reduce taxes for the very wealthy. Thanks to his 2017 round of tax cuts, but also because of the continuing cost escalation of Social Security, Medicare, and Medicaid, the federal budget deficit has grown to a dangerous and unsustainable level — over 6% of GDP. Without the revenue of tariffs the low-tax regime will fall apart. The Trump/Musk budget cutting chain saw can only yield minor savings — they don’t go after the real problems. So, the Trump regime must pretend to practice fiscal responsibility until Congress has approved his new round of tax cuts. The new authorization could come within weeks, so there is a chance that Trump could declare victory and relent at that time. But…
Other nations are just starting to react. Trump’s tariff announcement yesterday was merely the opening salvo in what is likely to become an extended trade war. Individual nations and groups of countries like the European Union have yet to announce their counter-measures. In the case of the EU, in particular, this presents a very special opportunity to strike against American hegemony in high technology services. I think the ‘Magnificent 7’ high tech stocks should be fearful. Europe has wanted to strike back for decades.
Actual economic impacts have not yet hit. Trump simply made an announcement. It will take days, weeks, and months before prices rise, and supply chains become significantly disrupted. It will be June before corporate quarterly reports show ANY impacts. At best, significantly increased US industrial production will not occur for well over a year. It takes years to plan and build a new factory. There is a time lag before economic pain will be felt and a much longer period before any potential benefits are realized. Much pain before any gain. Much continuing uncertainty.
There will be many twists and turns along the way. Over the coming months the focus of attention of this saga will shift. Like any war there will be numerous battles, victories and losses. Translated to the stock market, there is near-certain high volatility and a net trail of losses. Most wars these days are won by attrition — maximization of losses. “Buy the dip” has been replaced by “sell the rally”.
This is not over. In other instances of massive exogenous stock market disruption (1987, 2007, 1998, 2020-2022) a stock market crash continues until it has obviously ‘gone too far’. In most cases that will be a total market capitulation of 30% to 60% loss. This avoidable disaster of crudely implemented tariffs has only just begun. After a real crash will be a great time to invest in stocks!
In 2 days the Trump government says it will announce a comprehensive package of trade tariffs. These taxes will be imposed on top of the recently adopted 25% tax on imported automobiles and components, steel and aluminum tariff increases, and additional tariffs on products from China. This will be a surprise announcement — the Trump White House typically leaks information like a sieve, but this time the leaks are so confusing and contradictory that they effectively have been equivalent to a full news black out. The most quoted insider statement is that they are hoping to gain $6 trillion in tariff revenue over the next decade — $600 billion per year. A hundred billion dollars here, a hundred billion there, and sooner or later you are starting to talk about real money.
My opinions on this exploding Trade War don’t count. No one cares about my opinions, nor should they as I am not an economist, let alone one with extensive knowledge of international trade. Economics 101, however, told me that when “Trade War” is capitalized it is not a good thing.
What this blog does is to document how well my macroeconomic statistical forecasting approach succeeds in forecasting US stock market prices in time spans from 1 week to 6 months.
My forecasts are largely blind to what is coming. The monthly forecasting approach that I have been reporting on for 17 years sees a subdued next half-year. We have been inching toward a recession for quite some time. The probability of at least breaking even over the next 6 months is roughly 45% to 60%, definitely below the normal 70% to 85% likelihood. The predicted 6-month gains average at a below-normal 2% gain, but the swarming models range from -2% to +7%. The 1-month models are all positive, but slightly below average. I will report on my more advanced daily forecasting methods in a couple of days, after the tariff announcements, but their current numbers are comparable to the long-standing monthly models.
Last month’s sharp stock market decline puts the S&P 500 price almost exactly at my long-term price trend line, and the equal-weight Value Line Arithmetic Average is about 8% BELOW trend. So, unlike a few months ago, stocks now “have room” to move either up or down. That’s a good thing, but does nothing to suggest what happens next.
The U.S. stock market is overdue for a significant correction. The GDPNow forecasting model of the Federal Reserve Bank of Atlanta estimates that U.S. GDP growth has turned negative. When the economy sputters, corporate profits evaporate, and the stock market implodes.
My forecasting models currently expect problems with the stock market to hit somewhere between April and July. (They see a minor downturn, but nothing spectacular.) I expect a sharper decline a bit earlier, in March or April triggered by Washington craziness.
I curate many stock valuation models these days. Though all are based on macroeconomic data, they don’t fully agree; each considers somewhat different economic data sets. Collectively, the models are now more negative than positive. With my newer models, 1-month and 2-month forecasts are mildly positive (see chart above), but the 6-month forecasts are flat at best. My older models that have been running since 2007 expect a 6% loss over the next 6 months. A number of models in both the new and old forecast series collectively see the probability of gain for the next 6 months as 0.2 to 0.5 — that is way below the average probability of gain as about 0.75. So, collectively, these forecasting models say the stock market is about to roll over.
As I have written many times, these models don’t read the newspaper. They see weakness coming because the economy has been overstimulated, price/earning multiples are unsustainable, and leading economic indicators are starting to weaken slightly.
I live in Washington, DC and cannot avoid reading the newspapers. I see several ways the economy can be damaged in the near term. Some of this damage certainly will occur.
Reduced government spending: -1% of GDP A wild guess. The speed at which Trump and Musk have curtailed government spending has been breathtaking. I live in the eye of the storm and do not have a clear view of things. Too many people I know have lost their jobs or fear that they may be out of work soon. With many legal actions pending and the Trump administration just getting going, I doubt that a clear accounting is possible yet. So, it is just a wild guess that all the budget cutting will hit GDP by 1%. (Their goal is actually higher than this.) More likely GDP could drop something like 3% because of the multiplier effect of government deficit spending, disruption losses, malaise and fears. On the positive side, lower government spending can lead to lower taxes and therefore help both individuals and business — but these benefits will not kick in until 2026 at the earliest. The pain comes long before any gains. Will the spending cuts evaporate? Maybe.
Increased tariffs: -1% of GDP Another wild guess, but there have been estimates that the average American will incur roughly $1,200 in additional costs because of the China, Canada, and Mexico tariffs. Trump has referred many times to additional tariffs as well that would up the ante. There certainly will be increases in U.S. production due to the protections offered by the tariffs — But, any economic benefits will not occur for months of years — it takes time to build new factories, hire and train workers, and create new supply chains. The pain (probably mainly in the form of inflation) will come long before any potential gains. Will the tariffs evaporate? Maybe.
Cryptocurrency crash: -1% of GDP Just a guess. The underlying justification for these assets is that they cannot be affected by, or traced by government. Therefore they are the perfect way to hide illegal activity. I had my first experience with what is called The Intelligence Community in 1994. I have great faith that the Intelligence Community can track crypto just as much as it wants. Cryptocurrency is a bubble that will have a sudden and unpleasant explosion. I have no idea when the bubble will burst, but when multiple economic bubbles exist like now, they tend to pop at the same time.
Government shutdown: -1% of GDP Another wild guess since it might not even happen. On March 14, federal budget authorization expires and a partial government shutdown will begin unless Congress acts first. Though the House of Representatives have passed a budget outline, the details of any actual legislation are weeks away. Passage of the largest budget cuts such as for Medicaid is questionable. A Continuing Resolution (CR) to authorize spending at current levels until September 30 is the temporary solution that Republican leadership and the President want. The problem is that a number of Republican House members usually vote against any CR’s. And Democrats are unlikely to support a CR unless there is some sort of guarantee that the Trump regime will actually adhere to spending legislation rather than cutting spending at will. Thus, a confrontation and government shutdown is highly likely. The real question is how long it will last. President Trump created the government shutdown record of 35 days in his last term. Here the pain is highly likely and there is no real gain possible. Will the shutdown be avoided or curtailed quickly. Don’t know.
A Recession is zero net GDP gain and a 2% drop is enough to be called a Depression I have not seen a credible estimate of all the economic uncertainties of the moment, but they are both significant and real. Famously, Saul Samuelson quipped in 1982 that the stock market has predicted 9 of the last 5 recessions. That could easily happen again in a couple of weeks. Or not.
My forecasting models have started to twitch nervously, even though they still cannot read the newspaper. Overall, the models look at a significant array of economic data and conclude that the corporate economic environment is really pretty good. GDP is above trend. Profits are wonderful. The Federal Reserve is tightening less and less. Chances for a recession very soon are miniscule. All good. Unfortunately, stock prices generally are way above normal — historically above normal. Sooner or later something is going to break, with the question being: When? The exact “Why?” may be becoming clear.
My older econometric forecast formulas (followed since 2007, R.sq ~ 0.5) are turning somewhat pessimistic for the coming half year with an expected SP500 loss of roughly 4%. The 6-month probability of loss is slightly higher than the probability of gain. The newer forecasts (graph above) are based on much more data and “should” be more accurate. Just like last month, the newer forecasting models are a bit more positive than my older models with the SP500 gaining a bit for the next two months, but then falling so that the index is essentially flat by the end of July. Both sets of models are starting to fret a bit about late spring.
In my view, the new Trump-2 administration is trying to avoid having the US economy crushed between a proverbial rock and a hard place. The clash is not easily avoidable.
The crushing “rock” in the analogy is the US Federal Deficit. At 6.3% of GDP the current federal deficit is at an unsustainable level characteristic of economic emergencies. Usually, this level of deficit occurs when GDP is down (recession) and Federal recovery spending is way up, and it corrects naturally and quickly when the economy recovers and emergency Federal spending runs out. That is not the case today; GDP is already unusually high and most Federal stimulus spending has already run out. The crushing deficit today is structural, not temporary, and stems from entitlement programs (Medicare, Social Security) and the Trump tax cuts of 2017 that are expiring this year. If the tax cuts are not renewed, the deficit will quickly move toward normal. But, that probably won’t happen.
The “hard place” stems from Mr. Trump promising to renew the tax cuts and even increase them, adding further reduction in corporate taxes, lower taxes on social security earnings, increased State and local tax deductions, no tax on tip income, etc. He also has promised to leave Medicare and Social Security programs untouched.
The President has made clear that he intends to escape the deficit bind through drastically reduced federal spending and massive tariff increases. As he has said of the tariffs: “It’ll be a tremendous amount of money for our country, tremendous amount.”, also: “Tariffs are going to make us very rich and very strong.” So far, he has presented only a general sketch of his plans.
Supposedly, 25% tariffs on Canada and Mexico begin today, as I write. On the federal spending side, last week, there was a pause in nearly all federal grant programs and roughly a million federal employees received an email encouraging them to resign with the bonus of 6 months of administrative leave (or face unpleasant working conditions). There appears to be no legal authorization for either initiatives.
As of last Friday, the stock and bond markets appears to have ignored all the fireworks. I have a strong feeling that is going to change. For this spring, I expect a period of high volatility as world markets try to understand what is actually happening.
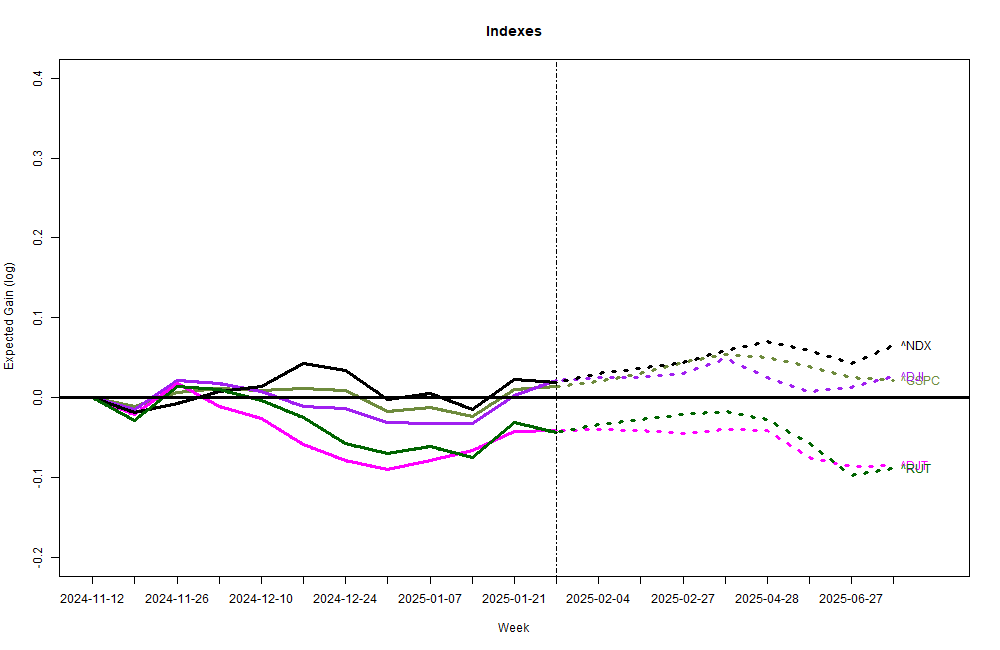
My models for various US stock market indexes are surprisingly positive for the first half of 2025: flat to negative for January, but then generally rising over the next 6 months. The forecast for the NASDAQ 100 ( ^NDX) is strong. My older monthly-based models for the S&P 500 and the ValueLine Arithmetic Average are not as encouraging, just flat for the coming half year.
The models reflect a strong macroeconomic picture. Gross Domestic Product is robust, running about 2% above the Real Potential GDP model maintained by the Congressional Budget Office. Inflation for consumers and industrial commodities is down, so the Federal Reserve has shifted from trying to restrain the economy to a more neutral stance. Interest rates are high-ish compared to the past half-decade, but rates are modest compared to the past half-century. Crucially, long-term interest rates have finally climbed above short-term rates; that is a good thing as it gives the financial sector room to breathe. Money supply if easing a bit; that’s always nice. Corporate profits remain strong. Several indicators say prospects for a near-term recession are minimal. Unemployment at 4.1% has crept up slightly, but is historically good. We are on the leading edge of major technological change through Artificial Intelligence, and already there are huge new capital investments underway with prospects for more to come. The stock market has scored up the best two-year returns since 1998! What’s not to like?
Unfortunately there are three problems that eventually will slam the stock market. The only real question is: When?
First, the US economy is only glowing brightly because of huge and unsustainable federal government budget deficits, not mainly through real intrinsic growth. Second, even if the economy was not propped up unrealistically, the market is still way over-priced by nearly all traditional valuation measures. Third, all other industrialized countries are going through the same process of cutting covid-related government deficits. Already, the parliaments of Germany, France and South Korea have fallen because there were no agreements on budgets going forward. Bond markets are starting to worry.
And, it is totally unclear what the U.S. Congress is going to do about the budget this spring. Will the deficit shrink or will it explode in size? Unknown. Aside from that, everything is great, and it doesn’t seem like the world is ready to explode this month.
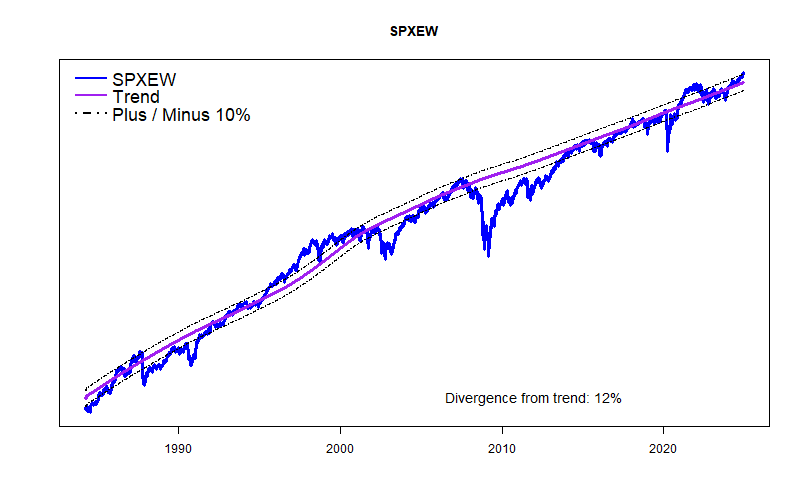
I recalibrated my long-term trendlines for the S&P 500 and the Equal Weight S&P 500. The recalibration better recognizes the impacts of inflation on the market. The modified trendlines have a slightly better fit with the past 4 decades of market behavior. The good news is that according to the new trend lines the S&P 500 is somewhat nearer to trend and the Equal Weight S&P 500 is actually slightly below trend.
(For the next year or so I will report on two sets of market forecasts. I will keep up my monthly forecasting models which I have documented for about 17 years. I will also be reporting monthly on newer market forecasting models that create forecasts on a daily basis. These newer models, however, have only about a year of forward-testing. I apologize in advance to both of my readers for confused reporting on the two sets of analyses.)
My original forecasting equations originating in 2007 are somewhat negative for the US stock market for the first half of 2025. My newer, much more data-intensive forecasts are mildly positive for the next 6 months. The difference isn’t huge, but it is real.
The stock market has been making new highs, climbing the Wall of Worry, and is historically overpriced. In the near term, stocks have plenty of room to fall down, but little chance of quickly falling up. Given those caveats, my forecasts for the near future are mildly positive.
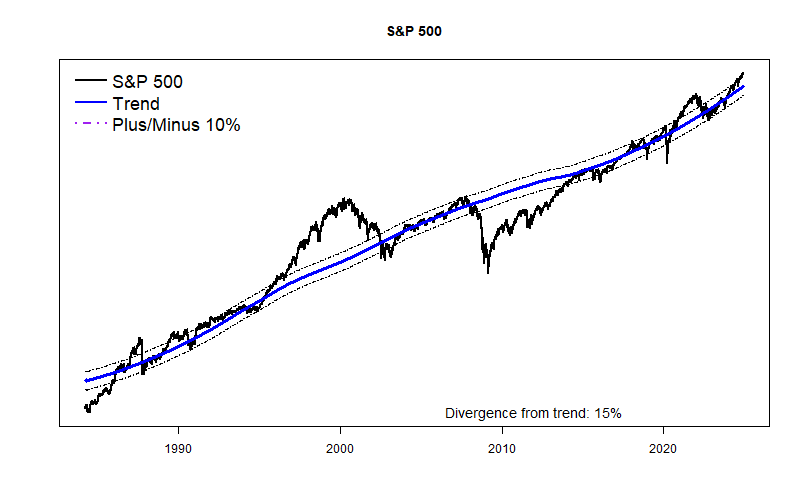
My long term trend models for the US stock market keep showing a developing price bubble. The S&P 500 is 15% above trend and the equal-weighted version of the S&P is 12% above trend. This bubble will probably keep growing. The bubble is still minor in comparison to the Dot-Com Bubble before 2000.
The Federal Reserve has begun to reduce short term rates, but the high level of short-term rates compared to long-term interest rates is still a very real negative factor in finance. Banks can’t make money lending money for long terms if they need to pay very much for short-term funds. They are painfully squeezed and have only been saved through Federal Reserve intervention.
On the other hand, truly massive Federal deficit spending — currently 6.11 percent of GDP — is dominating the economic situation. For comparison purposes, the total economic contribution of ALL FARMING to GDP is less than 1% of GDP ( 0.7%). Including all agriculture, food, and related industries takes the share up to just 5.6% of GDP. So, the US current deficit of greater than the economic impact of all the food we consume — all the food, supermarkets, restaurants, warehouses, even the Taco Bells! That is an incredibly high level of splurge spending that has only occurred during major national emergencies. It is not sustainable.
This spring the new administration and the new Congress will begin to deal with the deficit situation. It will either get better or get worse. (If you think the deficit will improve significantly, I’d like you to consider buying a nice bridge I recently obtained in Brooklyn.) Recent increases in long-term interest rates show that Big Money expects the deficit to get worse. In that case the stock market’s developing Bubble will expand. The math is pretty simple.
Forecast October 2024 thru March 2025: Climbing the Wall of Worry continues. My oldest and most accurate long term models are skeptical about the market, and have been negative for months. These econometric models can never forget the plunging prices of past stock market crashes. That’s their job. They are supposed to worry.
This time might be ‘slightly’ different. I won’t be surprised if the models are overly cautious for several more months, and the market keeps gaining.
The U.S. stock market is climbing a “Wall of Worry“, a classic stock market expression that applies at about this time during every business cycle. Stock valuations have been rising for several years and now are high by nearly all measures. But, prices keep rising anyway. ‘Everyone’ knows the market is overdue for a tumble, but ‘nobody’ wants to miss out on the relentless gains that stocks keep washing in. Eventually ‘all’ markets do falter, and most speculators are completely surprised. My most recent and detailed models say the end may not be imminent, At least, not for the next few months.
At the request of one of my few readers, I am bringing back my oldest and ugliest chart to illustrate. My wife calls it ‘garish’ and she is never wrong.
The graph below displays all of my actual 6-month market forecasts going back to 2007. The shape of the graph is the S&P 500 plotted on a logarithmic scale. Each dot is color-coded with the dot color indicating the approximate forecast value for the coming 6 months. (So, ideally a big market drop should follow a black diamond, and a strong market rise should follow a big green triangle.)
The message here is that the negative (red) forecasts of the past several months paint the wall of worry, just like they did through the pandemic mini-bubble. Eventually, they will probably prove to be approximately correct. At some point not too far away the market will probably be cheaper than is is today.
The plot (below) of a long-term model of the S&P 500 shows what certainly looks like the start of a new market bubble. Since at least 1871, the growth of U.S. GDP and the U.S. stock market have corresponded quite closely. That is no surprise: GDP tries to estimate the total volume of goods and services, while the S&P corresponds to a big chunk of that same economic output. The trend line here plots the current (and future) path of the S&P 500 based on the ongoing relationship between Real Potential GDP and long term interest rates. It is far from a perfect model, but it shows a growing divergence: a new bubble? (This model shows the S&P 10% above trend, another model says 14% above trend.)
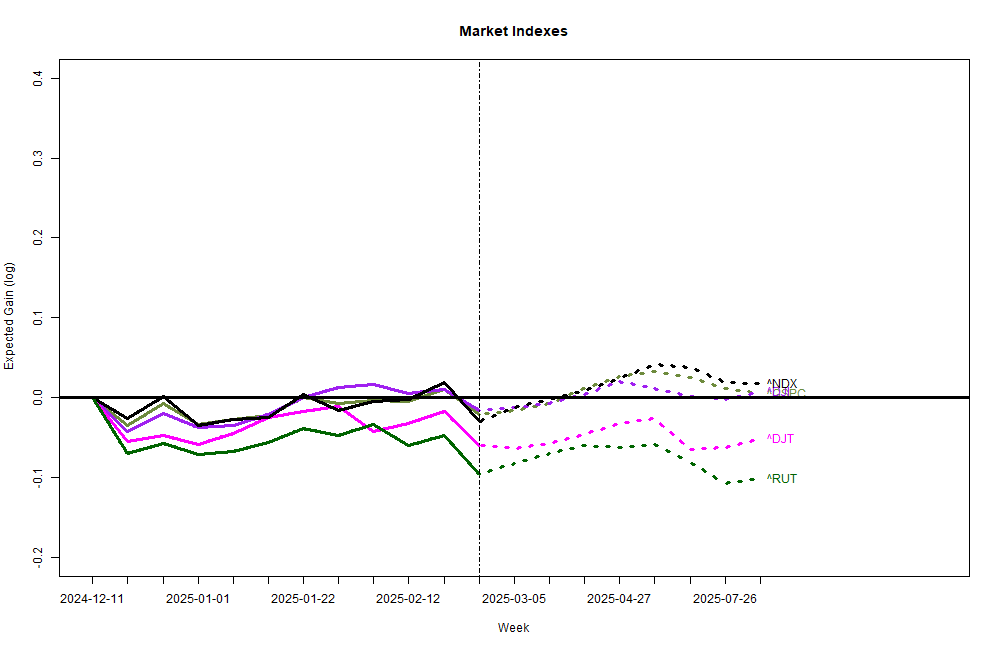
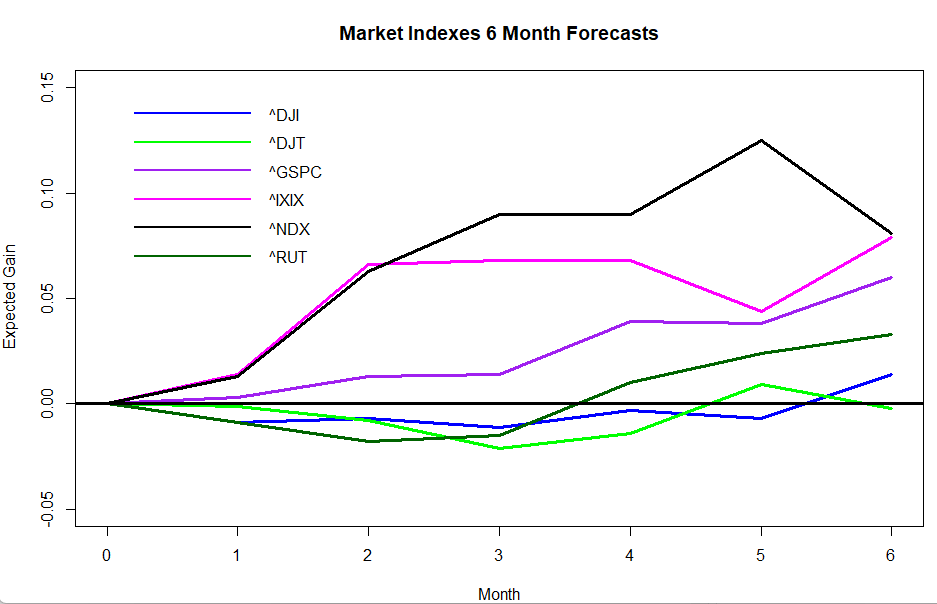
Here is a somewhat more positive look at a series of market index forecasts. The forecasts span from 1-week through 6-months. The models that produce these plots are based on gobs more data than my original models and are not quite as ‘fixated’ on the market crashes of the past. For good or ill, they are more trusting of current economic data.
If the Orange Octogenarian does something exceptionally bizarre in the next month, then all bets are off.
November was a fantastic month for most of the stock market, a wonderful pre-Christmas party, recovering the same 9% that it had lost in the months from August through late October. The party might well continue for some high flyers, but most stocks will probably stay in place for the rest of the year.
The spaghetti plot shows that the NASDAQ and NASDAQ 100 are expected to keep on climbing for the next few months with their party likely ending around March 2024. The S&P 500 is likely to pause over December and grow modestly during the early months of 2024. Non-tech parts of the economy, typified by the Dow-Jones Industrials and the Russell 2000 seem headed for a few weak months.
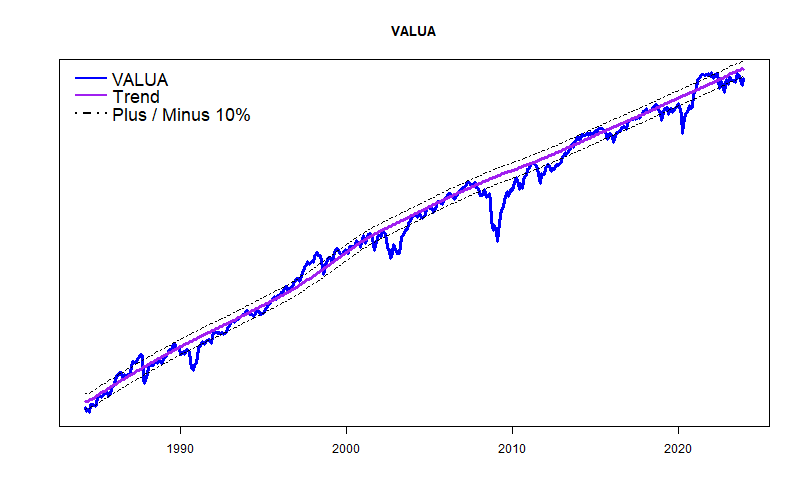
Looking at the long-term trend charts, it is clear that much of the ‘ordinary’ economy in the Value Line Arithmetic Index has been below trend for months, but the S&P 500 is almost exactly on trend. Of all my forecasts, Bank stocks as a whole appear headed for a few rough months — not surprising as long as short-term interest rates are higher than long-term interest rates.
The Alpha Test of forecasting a wide range of stocks and ETFs has been surprisingly successful so far. I hope that in January I will be able to upgrade it to a Beta Test — still experimental but a bit more deserving of attention.


