Tag Archives: economy

Irrational Exhuberance Revisited. Ulp!

(Spoiler alert: scary chart below.)

I have been working to add a quantitative measure of risk exposure to my stock market overview material. There are numerous ways to quantify risk, and I am trying to come up with some sort of composite indicator that includes the full spectrum of “make you want to puke” factors: excessive market valuation, financial instability, geopolitical disruption, political instability, Equity Risk Premium (stock rate of return versus risk free interest return), Things That Go Bump in the Night.

There are plenty of risk measures to choose from and most (except financial instability) are at dangerous levels right now. Using most any of these measures, if market prices were to get back to “normal” (whatever that is) then the stock market could quickly plop down 30% to 50%. If a couple of things went bad at the same time, things could quickly get even worse. Stomach shaky yet?

Anyway, as part of this quest I revisited the data set that Robert Shiller used for his 2000 blockbuster book Irrational Exuberance. He had incredible timing; the book was published just as the horrific Dot Com market crash began. Since publishing, he and Yale University have maintained and updated the data set here . It is a wonderful resource as it has numbers going back all the way to 1871.

Stock pricing is supposedly rational, so it would be reasonable to figure that the general ratio of stock price to company earnings (P/E) would be somewhat constant, or at least it would sort of follow long-term interest rates. It makes sense that it should appear even more smooth with averaging. Shiller’s CAPE P/E measure has a 10-year earnings average to filter out the noise. But even with that decade-long ‘smoother,’ the P/E path is anything BUT smooth.

Here is what I see in the chart; P/E, rather than being steady, follows a kind of rough pattern every few decades. After a severe stock market crash, P/E stabilizes for a while, but then begins an exponential, increasingly rapid, climb. Finally, when that rate of climb ‘turns vertical’, a severe market crash happens. Since 1871 I don’t see any cases of a fast rising P/E climb that smoothly leveled off. Maybe the 1960’s qualify as a P/E leveling, but that amounted in a lost decade for stocks. Yay! Pick your poison.

Right now, P/E is incredibly high and spiking vertically. As the Great Crash of 1929 hit, the CAPE ratio was nowhere near as high as today. The only other time CAPE has climbed this high was also in a spike, December, 1999. The great Dot Com stock market crash began four months later (March, 2000) and hit bottom in 2002 with a total fall of 49%.

I have no Idea if we are on the verge of a similar collapse, or when it might happen. But , I do not like the current P/E spike. It might it might be time to proceed with caution and pay close attention.

March thru August, 2026 — The stock market is OK, but starting to fade. As long as oil flows soon.

I have a new market summary graph that requires a bit of explanation. It shows 1-year historical price plots for the major U.S. market averages (S&P 500, NASDAQ, Russell 2000, Dow Jones 30) along with my 1-week to 6-month forecasts for each. They are increasingly flat. (As you will notice, I still have not avoided overlapping the labels for each Index. Sorry.) What is new, is the Consensus indicator below the graph. This Consensus indicator needs a bit of explanation.

When I started this blog nearly 2 decades ago, I had one set of formulas that made forecasts for a single market average (Value Line Arithmetic Average) for a single period (6 months), and I ran the evaluation once a month. Then in 2023, things exploded. I now run many thousands of models for over a thousand stocks, ETFs, and Indexes. The models involve a vast array of economic data and cover a full time span from one week, through a year. The models run at least daily. And instead of having a single model to make an analysis, every forecast evolves from consensus decision from increasingly large competing swarms of analyses. (I keep having visions of all the flying monkeys in the 1939 Wizard of Oz. Disturbing. They all work for me now.)

So, the 5-6 month Consensus value on the chart is the new ‘swarm vote’ of roughly 50 seperate and distinct analyses performed in different ways , often using distinctly data streams. For simplicity, I limit the vote tally to a range from +10 to -10. In today’s chart, the swarm was lopsidedly negative for 6-month market prospects (-10), but just slightly negative for the 3-4 month period (0). For shorter time frames, the group view remains positive (10).

The way I choose to read the Consensus reading is that our aging Bull Market is starting to show signs of weakness. The immediate forecasts are positive, but it is time to start paying attention. Surprise negative events ( massive oil supply disruption thanks to the U.S. attacks of Iran) are now much more likely than big positive surprises. It is a good time to be taking profits and reduce risk exposure.

If, or when, the 1-2 month and 3-4 month indicators seriously flash red, it will be time to take cover. And not wait for any 1-2 week warning.

The air attacks on Venezuela and Iran reinforce the need for humility regarding these forecasts. Even though these forecasting tools are gaining sophistication, they never can predict the unknowable or even the simple unknown. Caution is wise.

February thru July 2026: Slowly plugging along.

Both my long-running and more current data-intensive stock market models are positive, but unenthusiastic about the U.S. stock market for the coming 6 months. Last month the models expected the stock market to twitch around, but not rise much. And that is what happened. Sometimes these models actually are right.

Goling forward, the models expect flat behavior this month as well, followed by small gains over the next few months. For reasons I have not figured out, the current models see market jitters next month or in April.

Viewed from 30,000 feet, the market should be zooming up. Government deficit spending remains high, continuing to juice up GDP. The Trump tariffs have had a slight reduction in the federal deficit, but continuation of the Trump tax cuts and the addition of more give-aways have more than made up the difference. The AI infrastructure build out (software and hardware) continues as a historic spending stmulant.

The stock market, however, seems to be discounting the spending bonanza. My graph of the long term GDP-based trend of the S&P 500 shows it to be about 7% above trend which is not a big deal. The equal-weight version of the S&P 500 is running an anemic 1% below trend. If the overall economy was really healthy we would have seen a true boom/bubble. This looks more like a hospital patient being kept alive with heroic medical care, and held in a coma by heavy drugs.

Consumer spending continues to climb — but, most spending growth has come from the very wealthy, not the broader population. Unemployment is not terribly high at 4.4%, but the graph has a concerning upward slope and most recent employment has come in the low-paid health care industry. Corporate profits remain acceptable. Money supply is increasing at a moderate pace. Last year’s surge of the Magnificent Seven appears to be waning. The high relative growth of the S&P 500 versus it’s equal-weight version appears to have slowed-down and may be topping.

Could be worse, I guess. Another queasy market month would be fine, I guess.

Stocks for the first half 2026: Queasy.

The chart shows my forecasts (generated by my current data-intensive models) for the major US stock market indexes for the coming half year. I’d call that a “confusing” picture without a clear trend other than, perhaps “motion sickness”. The only of these indexes that has done well for the past quarter is ^DJT. (No, not the stock that lost 2/3 of its value this year and went from supposedly being a media Giant, to a crypto Mega Player and now to a Fusion Energy Leader. Good luck with that. This ^DJT is the Dow Jones Transportation Average).

This has been a year during which I have truly appreciated the fact that the stock market forecasts I generate are based on actual data rather than on my emotions.

Because my emotions have been frazzled — mainly because of all the twists and turns of the Trump government. Trump and his very determined team have kept up the tremendous viewer ratings he always craves — no one can stop focusing on every move. And suspense has been amplified; mainly because of all the policy shifts and reversals, but also partially because of the data gaps created through the Federal shut down, partially via lies and obfuscation, and partially because of the audacity of so many moves — or feints.

The overall economic picture, however, remains driven by a few main forces. The US and most of the rest of the world is still facing massive government annual deficits that keep overstimulating the economy in the near term (causing inflation), but simultaneously deficits are steadily worsening the overall strength and security of the financial system. (Fortunately, we have not yet seen a big spike up in long term interest rates — the sign of financial panic.)

We are also benefitting from massive investment in building out AI and it’s data infrastructure, but despite all the spending we are seeing unemployment creep up (4.6%) in a pattern that is similar to the lead-up to a typical recession. This market boom is showing its age.

There has been real economic damage caused by the Trump administration, but it has been largely hidden from view. The stock market did indeed keep climbing. But the real value of everything you own has tanked — the value of the US Dollar fell off a -9% cliff.

The Trump tariffs are having the effect of somewhat reducing the deficit, but already the Trump administration is talking about distributing more “helicopter” money in $1,000 and $2,000 checks. The net effect of all of this would appear to be that the economy will continue to be in an aging boom, that could be instantly slammed by a financial panic. I personally am feeling the same sort of “motion sickness” that my forecast charts are showing for the next few months.

My long term GDP-based trend lines are more comforting. They see the S&P 500 index as only mildly (6%) overvalued while the equal-weight version of the same stocks is just 3% above trend. Not too scary. Most recession leading indicators are still quiet.

My personal bet is that January could get ugly — I expect that now a new tax year has begun, a reasonable number of investors holding Magnificent 7 stocks will want to reduce their vulnerability. My older models see subdued gains for the first half year of roughly 4% ,and the probability of at least breaking even as around 80%, which is slightly below normal. The new models are a bit less confident but none-the-less positive.

So, I wish both of my loyal readers a joyful and prosperous New Year. And some luck.

October 2025 thru March 2026: Still Likely Positive

My 2-decade-old market models and my data-intensive AI models basically agree that the U.S. stock market will probably perform fairly well over the next half year with a gain of roughly 6%. The newer models have a few extra worries for the next month or so than the old timers; even so, they are positive/flat. This could change suddenly, of course, if the Government shutdown continues very long — your guess on that is probably as good as mine. Also, I have no idea what the immediate market response would be if the Supreme Court shuts down the legally questionable parts of the Trump tariffs. Again, your guess is as good as mine and my models are silent on the subject.

Overall, the U.S. stock market continues to be split: the AI-supercharged Magnificent 7 stocks are still surging and the established market keeps performing a bit below normal expectations. Right now, the S&P 500 is about 8% above my long term trend line. Last round, it turned south when it reached 10% above trend. (The trend line has been rather reliable for the past few years.)

There is a real split between short-term stock market expectation indicators and long term expectations. Short-term indicators like current stock market index trends and several leading indicators (like the Sahm Rule) have been rather steadily positive. It is as if stock market ’emotion’ has been inoculated in some way so that it no longer gets jarred by erratic moves by the White House. Professional economists, however, are less positive looking forward. In the most simple sense, on one hand they see bad news coming, and on the other hand they see bad news coming. The actual impacts of the Trump tariffs are critical. If tariffs do, indeed, produce a ton of revenue, that means a net reduction in government overspending/stimulus and so a drain on the economy. The other option is that the tariffs don’t actually reduce the deficit significantly — heading the U.S. toward a debt crisis.

By Halloween we should see if stock market investors will continue to keep “whistling past the graveyard”. Expect fewer chocolates this year if the tariffs remain intact.

September thru February 2026: Probably OK

My stock market forecasting tools are still blessed by not being able to read the daily newspaper. My hometown Washington, DC is essentially under martial law with gun-toting National Guard troops patrolling the streets reacting to a trumped-up ’emergency’ that does not exist, but my stock market performance models (except for September) remain reasonably positive. The forecasting models, with an excellent long term track record, indicate that a wide swath of U.S. economic data is basically benign and so the U.S. stock market will probably perform fairly well over the next 6 months. The September exception is that the S&P 500 (^GSPC on the chart) looks like it has gotten ahead of itself. Both my 18 year-old models with about a dozen economic variables and my current data-intensive models reach similar conclusions.

The macroeconomic data remains positive. Unemployment is still just 4.2%; money supply is growing at a 4% annual rate; inflation, only a bit higher than the Federal Reserve wants, is 2.7%; and corporate profits as of last quarter are growing mildly. Leading economic indicators generally are modestly positive with very low probabilities of a near-term recession.

The stock market division between highflyers like Nvidia versus the rest of the world decreased last month. As the graphs below show, the S&P 500 (NVDA accounts for 8% of the index) is now just 5% above its long term GDP-based trend line, and the equal weight version of the same stocks (SPXEW) is now exactly at the long term trend line.

I have a hunch that September will show stock market indecision, but volatility could easily shoot up toward the end of the month and into October. First, the question of the basic legality of the Trump tariffs will wind its way through the courts, eventually through the Supreme Court. Second, there is a significant chance of a U.S. government shutdown at the end of September since the FY2026 budget will probably need some measure of Democrat approval. And third, there is increasing concern over Trump’s health. (The helicopter flight path from the White House to Walter Reed Medical Center goes directly over my house.) I find a bit of comfort with the thought that the stock market, having weathered so much back and forth uncertainty in the Trump second term’s first months, may have been inoculated from instant major responses to potential new calamities. Wishful thinking no doubt.

Just before the storm? Or not?

Near term stock market forecasts from my most detailed current models are basically flat (above), but for the coming half year they are “OK”. Not great, just OK. My older models running since 2007 say about the same thing with a 4% gain expected for the U.S. stock market. Meh. As shown in the following graphs, the S&P 500 is running about 10% above its long term GDP-based trend line (a little worrisome) and an equal-weighted version of the same stocks is running about 6% below its long term average. Translation: the market is still dominated by high-tech high-flyers, but the broader market of everyday companies has been mildly weakening for some time.

What worries me at the moment is that my family has started to ask me if the stock market is going to crash. That is never a good sign; usually they pay no attention to this blog or any of my other stock market stuff. If they ask, it means they are actually worried. And if they are worried it probably means a lot of others are scared as well. If a lot of people get scared, then most anything can happen. Rapidly.

The best part about Donald Trump’s sweeping economic program is that very little of it has actually occurred. All those cutbacks in government programs? While painful to many individuals, most do not kick in until October, and even then they are mere pocket change in the overall economy. All the Medicaid cuts? Don’t actually hit until 2027. And the huge tariff increases? They were supposed to begin today, August 1, but then we learn they won’t be implemented until August 8. Or, until…. There has been so much word-garbage spewed by the Trump world that most of the financial world has turned a deaf ear and has returned to following the actual economic data numbers.

For now, the actual economic data are not very exciting. GDP is growing; how fast is a question because of freakish shifts in foreign trade and business inventories, but GDP is definitely growing and is already as high as the Congressional Budget Office sees as possible without over-heating. Money supply and interest rates are normal-ish. Unemployment at 4.2% is still low. Home building is in the dumps and unfortunately is likely to stay that way for the foreseeable future. Inflation has only ticked up a bit. The U.S. Dollar (DXY) rose a rapid 10% last autumn as Trump was elected — and then fell even more after his inauguration. The almighty Dollar is still falling.

But, the overall economy is basically pretty good. So what is the concern about a stock market crash?

Increasing financial instability Big money, the accounts holding billions and trillions, normally moves investments around very slowly. Big money, like an aircraft carrier, is well accustomed to the countless small ups and downs of the economic seas. But, big money accounts cannot accept even the smallest chance of a total wipe-out. So, when there is even a hint of financial panic big money stampedes to the exits bringing about a financial and stock market crash. It will probably start in the long term bond markets. I see two ways that the Trump administration has assured a financial crash; just a question of which? and when?

World Markets In 1997-1998 the world experienced a series of national financial collapses that largely stemmed from increasing U.S. long term interest rates. In one country after another (Russia, Indonesia, Malaysia, Singapore, Thailand, Argentina, etc.) economic collapse was sudden. It even got a name tag: “Asian Contagion”.

No one knows, of course, what the Trump tariffs will actually end up. It seems the President himself likes to be surprised by what he does. TACO? But, certainly the potential exists for nations with frail economies to begin a cascade of national economic collapses. With the U.S. on an isolationist course, a clear potential exists for massive financial failure contagion. This sort of crash would be horrible, but does not appear to be on the immediate horizon.

U.S. Debt As I have written for months, the U.S. federal deficit at near 7% of GDP is unsustainable. It cannot continue forever, but no one knows when trust in the “full faith and credit” of the U.S. will break. Trump’s ‘one big beautiful bill’ further increases the deficit. Deceit (with delays in Medicaid reduction and only partial accounting for new tax cuts) continues to hide the full scale of the new deficit spending, something like $500B per year. Eventually, probably already, big money will “sell USA”. It would be best if that occurs with a slow further decline of the Dollar and gradual increases in long term interest rates. But, that is usually not how these things go.

In answer to my family’s question about a stock market crash my response is that none of my fancy stock market models see a crash as likely in the next half year. But, my models really aren’t very good at spotting truly crazy behavior. Sorry.

Tariffs the only big missing piece of a bad puzzle

As I write on July 3, the U.S. House of Representatives has just passed Trump’s massive budget and policy bill; probably to be signed tomorrow. The remaining major piece of Trump economic policy to be settled will be the new large tariffs to be charged to products of all trading partners. Tariff outcomes may come into focus in the coming few months. A smaller, but quite important additional item is what Trump will decide about replacing Jerome Powell, head of the Federal Reserve. With these acts Donald Trump will have completed his redefinition of U.S. economic and foreign policy. Soon, we won’t be talking about the chaotic whip-saws of Trump policy making, but instead major macroeconomic movements will be underway — and not easily reversed.

My newer market models (above) are optimistic for the coming 6 months even though they generally see the markets as flat for the next month or so (partly since markets have risen so well this past month). My older models (with nearly 18 years of actual experience) are a bit less positive for the next 6 months, but several variants are distinctly of split minds for the next 3 months.

My puny stock market forecasting models only look 6 months into the future, and, frankly, they now are fixated on readings from a single long-standing data source. The models generally are largely unaware of the market distortions that will be created by the new tariffs, and they have only a hint of the significant increase in federal deficit spending or the retribution that world bond markets will enforce when they damn well feel like it. None the less, one leading indicator with a solid track record is flashing bright red.

The big concern of both sets of models is very specific: the current set of forecasts from the Survey of Professional Forecasters a set of detailed forecasts from roughly 40 top-ranked economists that has been recorded since 1968. Most of the other leading indicators I track point to a very low probability of recession or economic trauma in the next few months. The Survey of Professional Forecasters, however, sees a 35% chance of recession in the coming quarter — a VERY high number for this normally quite staid group. Clearly, they are extremely concerned about resolution of tariff turmoil, and doubt that it will end well.

The rest of the world is also worried. The Dollar Index (DXY) measures the performance of the U.S. Dollar against a basket of major national currencies. Since the start of the year DXY is down 10.4% — a major failing and the sword is still falling. The rest of the world obviously has grave doubts about the stability of the Dollar and the U.S. economy. It takes a lot of time to move trillions of investment out of an economy without causing a major alarm and a panic. But, that is what appears to be happening; and more should be expected. The stock market may continue to move up, but your actual wealth invested in Dollar-denominated assets is sliding down the drain. Keep watching DXY. A continued fall spells trouble.

Other than that, everything is great!

Trump blinked on tariffs. Still not usual economic times.

I wouldn’t pay much attention to these stock market forecasts for the next couple of months. Through executive orders Donald Trump continues to unpredictably shake up and shake apart the world economy. Then he largely reverses himself a few days later; saying that that is not what just he did. This is not usual for the US government and the economy, and it is not just about minor changes. My economic performance models don’t know about any really similar circumstances upon which they can draw conclusions. All they can estimate is what would happen if today’s situation was somewhat usual — which it is not.

My long term GDP-based trendline for the S&P 500 index is not much guidance either. Before April it was about 10% above the long-term trend. Then it crunched down in fear to being about 10% below trend. And now it is almost exactly at the trend line.

My older forecasting methods which have been documented since 2007 expect the market to probably slide a percent or so over the next two months and then stage a mild rise. My newer and more elaborate forecasts (shown at the top of this blog) say about the same thing.

What really matters, though, is what Donald Trump and the Republican Congress actually do about passing a budget authorization for FY2026, dealing with reauthorization of the US debt, and setting up a tariff regime that lasts for more than a few weeks. What could go wrong with that?

My guess remains that there will be a great deal of puffery and grandstanding. There will be much fear and theater. But, in the end they will declare a great victory of cutting spending and lowering taxes. This will actually result in some new and wonderful tax-loopholes, a major increase in wasteful government spending, and most importantly, a huge expansion of US debt. Most probably they will blame this on the Democrats.

Come July, I think a stock market boom might be underway. I feel sick.

Weeks of bad stock market news coming.

The US stock market will likely be in free-fall for a few weeks until Congress passes the final version of the FY 2026 federal budget. No bottom in sight. But, short sellers should pay attention: instantly after the budget bill gets signed the stock market could launch an amazing boom and bubble. For geezers who might still retain a few memories, this probably will be similar to the 1998 stock market crash: sharp, deep, V-shaped, with a fast rebound. Don’t blame me; I’m just the highly fallable messenger.

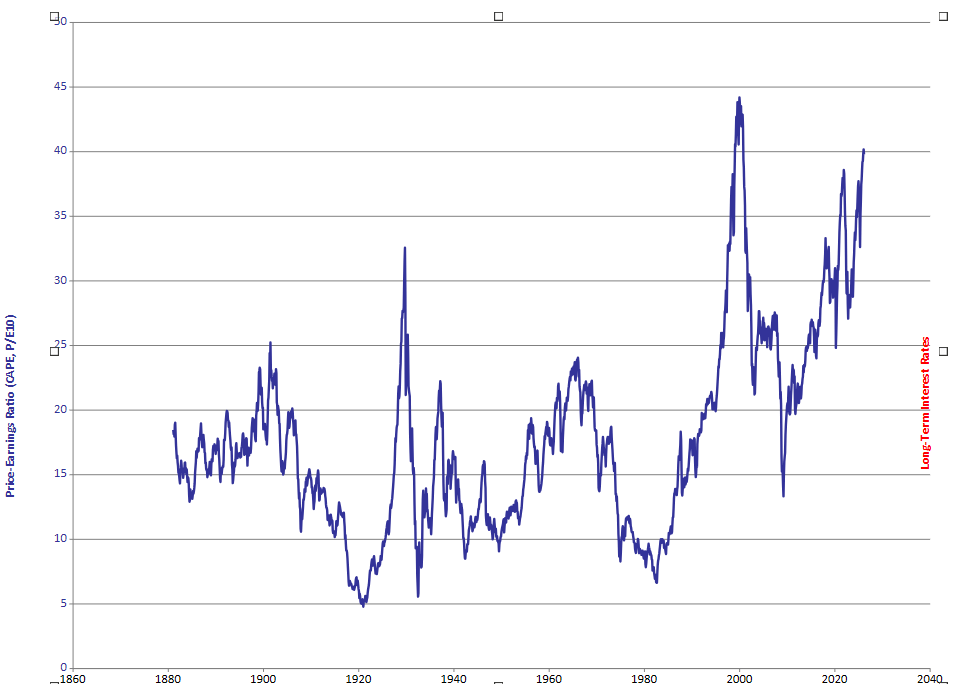
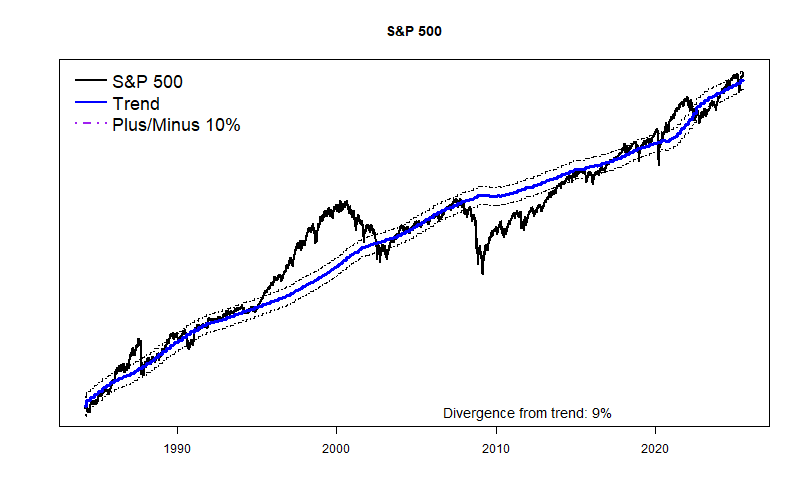
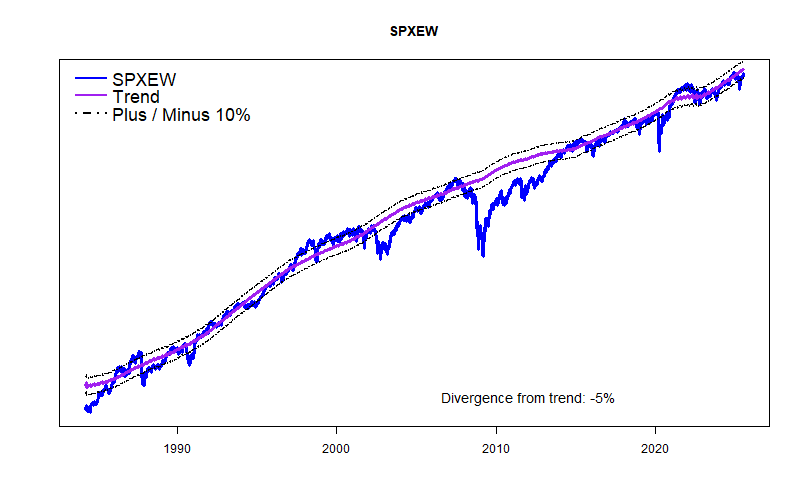
Last Thursday and Friday stock market sent a clear message on Trump’s kind and gentle tariff announcement by immediately staging the worst 2-day market collapse ever. Ever. Prior to the announcement, stock prices were still elevated as they have been for many months, so there was plenty of room to fall. Even now, there still is plenty of room below.

Unless the President relents and eases the tariffs, the market faces only more bad news or worse, faces continuing unknowns about how the tariffs will actually affect the economy or how other nations will counter the tariffs, or further escalate the trade war. We have yet to learn, for instance, how the European Union plans to react to the tariffs. (I personally expect a major hit to US services in Europe where we are actually running a massive trade surplus. There go The Magnificent Seven.) A zero response from Europe is unlikely. Neither have we seen how much consumer prices will actually rise, how much business production will drop, or how much unemployment rises due to decreased economic activity. Multiple globs of bad news will probably keep falling down in coming days and weeks. We won’t see the actual drops in US corporate profits for months and months.

Any potential good news of US industrial redevelopment is months or years away. What’s at stake is that the US economy could quickly be in a significant recession. Fear alone is enough to cut demand enough to create a recession. It doesn’t take much, just a 2% to 3% cut in what people buy. The World economy is also in jeopardy. With a sudden recession stock prices can quickly fall a further 30% to 70%. An extended recession or depression could be worse still. All unknown now.

Many have wondered why, other than sheer incompetence, Trump chose to pull together and implement an instant slap-dash set of simplistic and drastic tariffs. Tariffs aren’t a new thing. Queen Elizabeth I used them to protect wool knitters. Throughout the past several hundred years tariffs have almost always come out of extensive lengthy negotiations and have been implemented with lag times to permit adjustment by the economy. Often a threat of tariffs has been enough to change things. What’s different this time? The answer is simple: He needed to have the massive taxes in-place now! They had to be gigantic and they had to be actual, not just in discussion. The bigger the better. Might make sense to go higher still. (see below)

Reconciliation budget Trump and his maga crew desperately want to extend the expiring tax cuts they enacted in 2017, and they want to add in roughly $1.5 trillion is new tax cuts. This can only be achieved via the appropriation budget for FY 2026, which along with an expansion of a massive deficit approval must be passed in the fairly near future. But, to get their way without input from Democrats, they need to use a congressional approval process called “reconciliation”. The final bill must pass both houses of Congress, and because of a Senate rule, it must not increase the long-term US budget deficit. “Arcane”, is a word typically used to describe the reconciliation process meaning mysterious, secret, confusing, or convoluted. Flim-flam scam, Kabuki theater, and “Lets’ just pretend” might also be used.

Here is how it needs to go.

Both houses of Congress have now passed resolutions that outline their versions of a new FY 2026 budget. The outlines are similar, but they contain few details. Crucially, these budgets will only balance via major cuts to federal spending programs and if truly massive tariffs are in place to make up for the revenue lost by the many tax cuts. The higher the expected revenue from tariffs, and the more spending can claimed to be cut, the more tax cuts can slide on through. For the legislation to gain approval from the Congressional Budget Office, the tariffs must be either in-place or fully defined in the legislation. Importantly, if the tariffs are contained in legislation two bad things would occur. First, the representatives would get blamed for imposing huge new taxes. Second, the tariffs would be much harder to remove later. Trump’s Executive Order saved then from catching any blame.

Filling in the details of the budget legislation is what is going to take a few weeks. Getting agreement on all the budget cuts that need to be made is going to be a problem. In particular, approximately $800 billion is health care is scoped for elimination. Also, many of the federal programs that have been scrapped actually are very important for various people. These will be a difficult pills for many Republican representatives to swallow. So, there may be additional show-downs and delays. Uncertainty will exist. “Brinksmanship” is a word that is often used to describe these negotiations.

The key, however, is that without the draconian tariffs and spending cuts in place, the reconciliation budget and its glorious tax cuts cannot pass. The tariffs must remain in-place for the next few weeks. Trump must pretend, at least, that the tariffs are real continuing policy.

Once the budget has been signed into law, the “Let’s pretend” theater can end. Instantly. Trump will be free to drop tariffs to the extent reality demands or that his whim and “instinct” feels is right. That is the moment that can also bring massive “emergency” spending, and could bring about a major “short squeeze” in the stock market.

But, until the budget gets passed, I don’t see anything but really bad news for the US stock market.

I hope I am wrong.