Be Careful What You Wish For

The U.S. economy is doing very well. Unfortunately, it is starting to do a bit TOO well.  That has happened before, and these episodes of economic boom never end well.  This one won’t end well either.  My guess remains that the demise will occur in one to three years.

The Congressional Budget Office is well known for the ‘economic scores’ that it calculates for the impacts of proposed congressional legislation.  In calculating those scores CBO relies on an economic model of the U.S. economy that it created many years ago and has been improving ever since.  The CBO model estimates how large the U.S. Gross Domestic Product should be if the country were at full employment, giving the model the name of  ‘Real Potential Gross Domestic Product’.

The CBO model gets tweaked every now and then, but not by much.  The last adjustment I can remember was a small downgrade of future estimates to account for changes in how fast the baby boomer generation is retiring. That’s why current estimates for best case GDP growth are lower that previous decades.

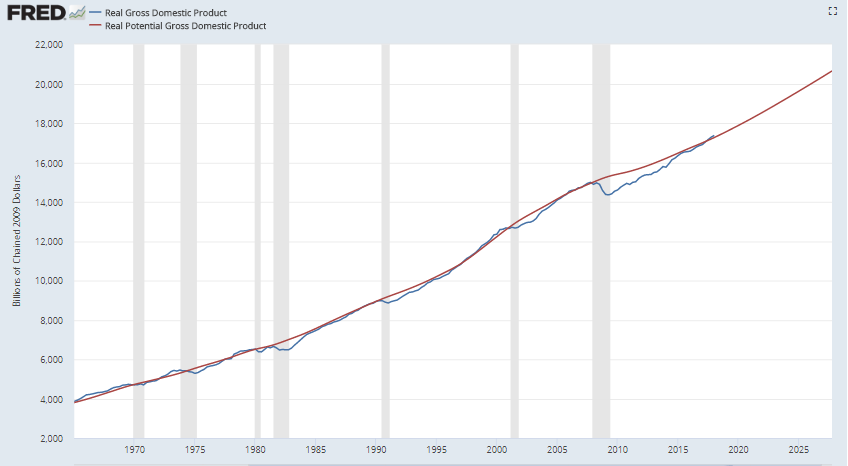
The graph below was downloaded from the Federal Reserve public data site ‘FRED’.  It shows CBO’s Real Potential GDP model and actual values for U.S. Real GDP.  (‘Real’ meaning that inflation has removed from the data so that everything is shown in constant 2009 dollars.)

(Click on image to enlarge, Esc to return.)

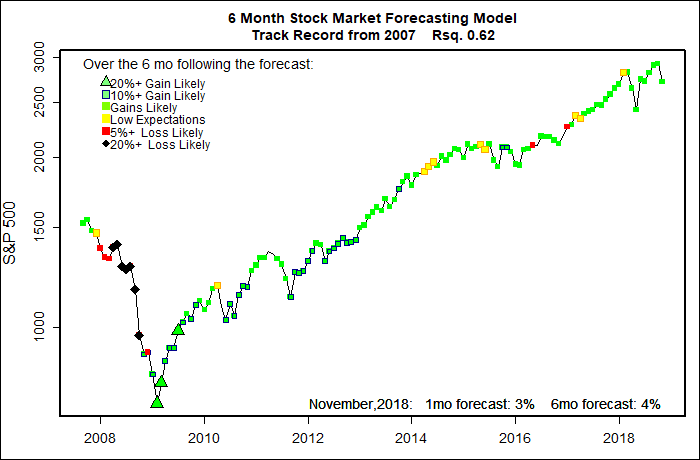
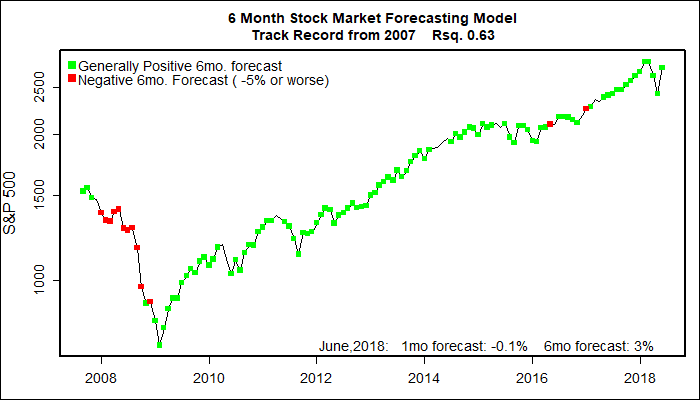
The match between actual GDP and the CBO model are amazingly close nearly all of the time.  The big exception of course is when actual GDP plummets several percent causing the country to suffer a recession.  (The gap caused by the Great Recession was unusually large — that’s why it was the ‘Great’ recession.)  As a general rule, the stock market suffers a collapse as investors realize a recession is nigh, and the market rebounds sharply when it appears that the economy is likely to recover.

It is worthwhile to click on the graph above to look closely.  Prior of most recessions the economy tends to perform better than the Real Potential GDP.  That exceptional performance can last for as long as several years — until the Fed decides the economy has become overheated.

GDP now is better than expected by the long term model.  In part that is due to the normal turn of the business cycle.  We are at the boom part of the cycle.  This time, however, normal cyclic economic expansion has the incredible financial stimulus heaped on the economy by the  deficit spending of the Trump tax cuts.  The stimulus is twice as large as the stimulus provided by the Government at the depths of the Great Recession.  That load of cash is just starting to hit the real economy.  A major boom is underway. That is wonderful!

But, the boom, inherently, will not be sustainable.

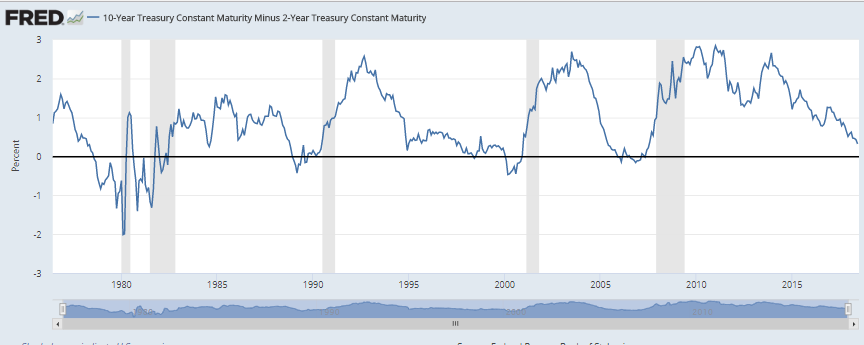
For years the Federal Reserve Bank has been raising interest rates very very slowly, trying to move them from the historically low rates necessary to break the country out of the Great Recession.

If, or rather, when the Fed determines the economy is becoming frothy, the Fed will increase interest rates faster until the economy cools down.  That will bring the next stock market crash.  Like any tragedy unfolding, the only questions are: Exactly how? and Exactly when?

Stock Market Spoiler Alert

The forecasting model says:
July:  -0.3% (below average, typical for summer)
Next 6 Montlhs: 4% (slightly below average)
Probability of at least breaking even:  0.59 to 0.96 (Above average)

What am I doing? Staying fully invested. Expecting continued volatility through the November mid-term congressional elections.

Spoiler Alert: Eventually the stock market will crash —  before the business cycle turns sour — and most probably as a direct result of the Federal Reserve relentlessly raising interest rates to rein in a frothy economy. But, don’t hold your breath waiting for the crash.  At least, not for a year or more.

The difference between short and long term interest rates, the so-called “interest rate spread” shows in very slow motion how the Fed can, and will,  choke off the economy when it decides to.  

The nature of  commercial lending is to borrow money on a short term basis at low rates and then lend it for long term projects at higher rates.  The lender profits from the spread between the short and long term rates. (Think of a bank using your savings to make housing and car loans while paying you almost nothing in interest.)  When short term interest rates start to equal, or even exceed, long term rates, the lending market dries up. Loans stop being made and the economy stumbles.


(Click on image to enlarge.)

The Federal Reserve database chart above shows the half-century history of the spread between the 10-year Treasury bond interest rate and relatively short term 2-year interest rate.  Over and over again, roughly a year after the short term rate equals of exceeds the long term rate the economy goes into recession.  Routinely, the stock market crashes before the recession actually occurs.

The key take-away here is that the interest rate spread has been falling for several years and already is getting pretty low.  It is almost time to start paying attention.  A stock market crash now is on the visible horizon.  

I remain convinced, however, that the next crash is still only on the far horizon — still one to three years away.

U.S. Stocks June thru November, 2018: Uneventful?

What the forecasting model says:
One Month Stock Market Forecast June, 2018:  -0.1% ( below average)
6 Month Stock Market Forecast May thru October, 2018: 3% (slightly below average)
Probability of at least breaking even:  0.57 to 0.94 (Surprisingly high)
What am I doing? Staying fully invested, still thinking the March – April downturn was healthy, and last month’s rebound was normal.

(Click on image to enlarge.)

The current one-month forecast is slightly negative at -0.1%. That is no big deal as the one-month forecast is not all that accurate anyway.  I only pay attention if it forecasts a one-month drop of over 1% — not usual and a definite bad sign.  Most likely the model is just showing a small bias against market performance during the May to November period.  Same story for the 6 month forecast of a 3% gain — slightly below normal.

Unlike my model, I personally expect to see extra volatility over the next half year due to the mid-term congressional elections.  Come the first week of November I think it is highly likely that about half of U.S. voters will be upset with the outcome.  Before that there is a very good chance that even more than half of the U.S. population plus foreign investors will be anxious.

To me, that is a scenario of market volatility.

But, my soul-less, nonpartisan mathematical model is right about the next market moves much more often than my personal expectations.  That’s why I built the model, after all.

Stock Market Prediction May through October,2018: More Chop Than Trend

What the forecasting model says:
One Month Stock Market Forecast May, 2018:  NO GAIN ( below average)
6 Month Stock Market Forecast May thru October, 2018: 2% (below average)
Probability of at least breaking even:  0.43 to 0.91(I’m a bit concerned.)
What am I doing? Staying fully invested, still thinking the March – April downturn was healthy.

(Click on image to enlarge.)


The Dog That Stopped Barking
So, what’s up?  The economy is doing just fine. Unemployment is historically low.  No recession is in sight. The big Republican corporate tax cuts are kicking in and are guaranteed to lead to corporate stock buy-backs.  (The buy-backs have already been announced in advance. Increased profits are going to be used to buy up stock prices, not for capital investment.)

So, why isn’t the stock market zooming up?  The stock market is down for another month. And, my models are predicting a basically flat stock market for the next half year.

My Models Think the Dog Barked in Anticipation and Shut Up When The News Hit
The graph below is a plot of how my 6-month stock market forecasts (red line) have compared since 2007 with actual 6-month stock market increases (black line). The other lines are some of the alternative 6-month forecasts I use in creating my composite forecast.  

(Wonkish: I use VALUA, the Value Line Arithmetic Index as my actual market gauge.  It performs much like the S&P 500 but tends to be a bit less volatile.)

Note that the black line (actual 6-month market performance) ends before the other lines. What that means is that the most recent actual 6-month performance is from last November thru April.  The red and other lines are predictions for the future.

The gist of the graph is that for most of the past year the stock market has performed significantly better than my forecasts.  Investors clearly had a lot of giddy enthusiasm.

There now is a developing realization that the Federal Reserve Board has no intention to allow the economy to seriously overheat.  The Fed will trump Trump’s tax cuts.

Look at the graph once more —  as a broad generalization over the past decade, the most typical situation is that after the stock market has exceeded expectations, it will typically perform below expectations.

So, although the models see a flat market coming up, I personally expect flat to somewhat negative market performance for the next half year.  What happens near the mid-term congressional elections in November is a really big unknown.

Why don’t I quit the market now? Many scenarios I have run through my models suggest that the best results occur by trading infrequently — waiting for a really rotten forecast before escape. My hunch remains that the time for exit will be a year or two from now…


(Click on image to enlarge.)


Stock Forecast April through September, 2018: Headwinds Continue

What the forecasting model says:
One Month Stock Market Forecast April, 2018:  0.2% gain ( below average)
6 Month Stock Market Forecast April thru September, 2018: 2% (below aerage)
Probability of at least breaking even:  0.37 to 0.91(OK, but down from last month)
What am I doing? Staying fully invested, relieved by the March correction.

Click on image to enlarge.

March was a tough month for U.S. stocks. Both of my readers may hate me, but I think the retrenchment was a good thing. Over the past year stock market performance had gotten ahead of fundamentals and volatility had been unusually low.  Too many investors had become over confident. It was time for the market to “revert to the mean” as the statisticians say.

My predictive models are pointing to a somewhat weak, but probably not declining market for the next month and through the next six months.

Why? IMHO
After a likely bounce back from the March correction, large stock price gains are not probable over the next half year. The economy has nearly fully recovered from the Great Recession and the easy economic gains have been won. It’s like the situation of someone recovering from injuries from a bad traffic accident. At first they can make great healing progress.  But, when they are back to normal they simply can’t enhance their health at the same rate.

Second, while there is little room for easy gains, there is little likelihood that a significant economic setback will hit in the near future.  Leading economic indicators and several models used by economists give very low odds of a recession in the next half year.  The massive tax cuts and spending increases passed by Congress will boost the economy for the short term.  (So what if nearly every economist on the planet thinks these measures to be counter productive and horribly timed. In the short term they certainly will provide a kind of “sugar high” for the economy and the market.) The tax cuts and spending increases total approximately twice as much in joy juice as the Obama emergency stimulus package that kicked in at the depth of the recession.

On the negative side many investors appear to be deeply worried about Trump starting a world-wide trade war.  As far as I can see, there has been much more talk than action on tariffs. I have great faith that any U.S. economic interest groups that feel hurt by any changes will rise up in holy wrath and force the U.S. government to reverse course. Besides that, in the next 6 months any economic impacts of new tariffs are unlikely to show up in economic data.

Third,  historically during the summer months and early fall the stock market has typically been weaker than during the colder half of the year.  It is not a huge effect, and it is often wrong, but the maxim of “Sell in May and go away” has been shown to have some validity in a range of economic markets for at least the last 300 years.

Fourth, the battle over the mid-term election for Congress is just starting to heat up and will reach fever pitch by late September.  There is not much doubt that twists and turns will lead to greater stock market volatility.  By the end of the process approximately half of the U.S. population will be very worried and upset. That is not the setting for a major stock market advance. Maybe after the election ?????

So, I expect a bouncy market ride through the next half year with little net change at the end of the period. It is probably best to avoid discomfort by paying less attention to market gyrations over the next half year.

What Goes Up …..

One Month Stock Market Forecast March, 2018:  0.5% gain ( near average)
6 Month Stock Market Forecast March thru August, 2018: 3% (a little below average)
Probability of at least Breaking Even:  0.43 to 0.92 (above average, but a wide range)
What am I doing? Staying fully invested, but realizing stock melt-ups end.


(Click on image to enlarge.)
January and February marked the return of volatility to the U.S. stock market.  January was incredibly good, and February had a nasty market correction with a sharp recovery in the later part of the month — none the less resulting in a loss of about 4% for the month. Right now the stock market is pretty close to where it was as at the end of last December.

According to my models, the U.S. stock market has performed somewhat better than expected  — exuberance and optimism have dominated action spurred on by real world expectations of high corporate profits stemming from huge cuts in tax rates, and massive increases planned for federal deficit spending.  It is quite an economic party. Might as well enjoy it.  My personal guess is that it will run another year or two, probably blooming into a true bubble.

(The rest of this post is boring.  Feel free to ignore it. It is just rant and opinion rather than proven math.  Have a nice month.)

We all know that eventually reality will settle in to stock market prices.  This stock market party is going to end — abruptly. Most all widely accepted metrics say the market is over priced. The Federal Reserve will raise interest rates enough to bring the party to a close.  (It usually takes about a 3% rise in interest rates. The increase has to be swift.)

As it is supposed to, the Federal Reserve, in time, will “take away the punch bowl” from the party.  There will be a classic rush to the exits. All of the Greater Fools will end up in the drunk tank. 

Currently, the Fed continues to raise interest rates very very slowly.  Unusually slowly.  It is a bit like the Fed Directors are saying: “Don’t worry. We are just raising the price of the punch a bit.  This party is really great and we aren’t trying to shut it down.”

The big question for me is not whether a stock market crash is coming in the next couple of years.  A crash WILL come.  Crash is what stock markets have done for hundreds of years. Every time.

The big question for me (and, no doubt, all three of my loyal readers) is whether my econometric models will have any success in predicting when the party will end with a crash?  Have the new factors of massive tax cuts and huge spending increases changed the rules?  Are we in a truly new situation that defies forecasting?

I think the models will hold up pretty well.

The essence of any stock market crash is getting enough people really, really, scared of a market Armageddon — at the same time.  It takes months and months for fear to accumulate to a terrifying level for enough people.  Until then, smaller groups of investors will have bouts of temporary jitters.  Particular market sectors will go through trauma resulting in increased overall volatility for the market.  

Counter intuitively, each time the overall stock market survives a shot of volatility, it builds faith in the investing public that the stock market can survive the next round of volatility.  Faith in “market momentum” is what ruins most investors during a market crash.  First, they hold on for dear life during a downturn believing that the market will quickly recover. Then, after capitulating and selling all their stock, they believe that momentum will keep sending the market lower and lower. They are losers who buy high and sell low. Believing in market “momentum” is a very dangerous thing — and the bogus basis of the astrology-like art of “Technical Analysis.”

My models have nothing to do with so-called market momentum.  They are all about a handful of economic statistics that have shown themselves for decades to lead the stock market by about 6 months.  Looked at closely, most have a high degree of “emotionality” — the forces that drive these measures can change dramatically in a short period of time. They say a lot about the people who developed them and who compile and adjust them. In one way or another, the majority of the indicators I use are influenced by the emotions of a reasonably large number of people.

So, I think the models will be OK.  We’ll all see in a year or two.

Stock Market Starts to Face Headwinds

One Month Stock Market Forecast February, 2018:  0.3% gain ( near average)
6 Month Stock Market Forecast February thru July, 2018: 0% (well below average)
Probability of at least Breaking Even:  0.58 to 0.88 (below average)
What am I doing? Staying fully invested, but realizing things have been going too well.

The U.S. stock market has been doing incredibly well, better than my forecasting models expected.  The models had predicted market gains, but not as good as what the stock market actually did. That’s fine — I’d rather be prosperous than exactly right.

The flip side is that the stock market has been doing too well.  It is not just my models saying the market is lofty.  Morningstar.com calculates that the market is 9% above Fair Value. That might not seem very serious, but since 2000 their Market Fair Value by Sector has seldom been higher (14% in 2004).  Spend some time looking at the Morningstar chart using the “Max” setting. When they calculate that the market is way above Fair Value, the market usually has a correction soon.


(Click on image to enlarge.)


Though my quantitative models see a flat market coming by summer, I personally expect the market to perform better than that.  The combination of continuing low interest rates, corporate tax cuts, and increased federal deficit spending have created a lot of stock market enthusiasm.  To me, that market enthusiasm looks more and more like the early stages of stock market bubble euphoria.  What goes up eventually comes down. But, for now, the optimism appears to have staying power.

My forecasting models only see 6 months ahead and they have been quite accurate (R.sq = 0.6) for the 10 years I have been publishing results.  But, knowing the factors in the models, my personal guess is that we are on-track for a major stock market bubble that will pop as early as this summer, but almost certainly within 3 years.

Hopefully, my econometric models will give me and both of my faithful readers plenty of warning. I intend to enjoy the ride, but I accept the fact that sooner or later there will be a market crash.   (My guess: 1 to 3 years from now.)

U.S. Stocks 2018: Late Stage Bull Market

One Month  Stock Market Forecast January, 2018:  0.7% gain ( near average)
6 Month Stock Market Forecast January thru June, 2018: 4% (somewhat below average)
Probability of at least Breaking Even:  0.9 (above average)
What am I doing? Staying fully invested with no clear reason to leave.

(Click on graph to enlarge.)


My stock market prediction models expect U.S. stocks to grind higher through the first half of 2018 with roughly average gains.  The tilt of the market remains positive with the probability of at least breaking even in the first half of the year at a strong 90% (compared to the long term average of about 74%).

Though the predictive models expect January to produce some gains, I have my doubts.  The market produced spectacular gains through 2017, and as a result investors held on to their gains through December. (Who wants to pay tax for stock sales in 2017 when they can stall taxes for another year?)  With the start of the new tax year I expect some nervous investors will want to ditch some stocks with lofty valuations during January.  

MorningStar.com calculates Market Fair Value By Sector hereCurrently they consider  the market to be roughly 6% above Fair Market Value.  Typically, a temporary retrenchment toward fair value follows before too long.

2018 Outlook 
Hopefully, the first half of 2018 will, in fact, play out as favorably boring. That is the best possible outcome.

If the market really surges in the first half of 2018, the second half of the year could see the market take a significant hit.  (Just a personal opinion, the models do not see that far out.)

Higher corporate profits stemming from the Republican tax cuts may well kick in at just the wrong time fostering a market bubble that will be prone to pop.

The U.S. economy is already doing quite well.  Gross Domestic Product crashed down during the Great Recession, but has now climbed back up to what economists see as the true long term potential for GDP. Closing the gap with Potential GDP has been the principal force driving the stock market higher since 2009.  Now the gap has closed. Prospects are now more limited.

There is little to worry about immediately. Near term prospects for a recession, key to a strong stock market, are very low according to several metrics.  This is about as good as it gets for the economy.  Anything better would be considered ‘overheating’.


(Click on graph to enlarge.)

As slowly, steadily, and as transparently as possible, the Federal Reserve has been raising short term interest rates.  By also starting to sell off their huge portfolio of long term debt they are also hoping to nudge long term interest rates higher.  Generally, these rate hikes have been expected and even welcomed as a sign that the Fed finally feels that the financial system can get off emergency life support and get back to normal. Interest rates are still very low by historical measures.

Potentially, if the Federal Reserve becomes concerned of the economy overheating, it could start to take the punch bowl away from the party in the second half of the year. It wouldn’t be hard — when short term interest rates are higher than long term rates, commercial lending freezes up, and major financial institutions get into jeopardy.  The economy stalls .  But, before that happens, the stock market crashes. That is the typical scenario for a major stock market crash. 

As the next graph shows, there is still a safe spread between short and long term interest rates.  This could last for years if the Fed wants.  But, the end game is coming in to view. Watch to see this summer if the Fed becomes more aggressive in raising rates.

(Click on graph to enlarge)


And then there are the mid-term congressional elections to unsettle the waters come summer.  Just as the tantalizing prospect of corporate tax cuts provided a rosy back drop for the stock market in 2017,  a major turnover in congressional power could wipe those tax cuts out going forward.  A large number of unnecessary enemies were created in the Republican tax cut drive. A majority of Americans will be wanting change.


Stock Market Forecast December, 2017: Visions of Sugar-Plums Dancing

One Month Forecast December, 2017:  1.3% gain (above average)
6 Month Stock Market Forecast December thru May, 2018: 3% (somewhat below average)
Probability of at least Breaking Even:  0.94 (decidedly above average)

Parents of young kids know the dark humor of the classic poem Night Before Christmas. The line  ‘while visions of sugar-plums danced in their heads’ sounds innocent and happy, but every parent knows that a real sugar high ends with the kid crashing fairly soon into an emotional wreck.  It is never a question of “if”, just a question of “when” the child’s blood sugars will drop and things turn dreadful for everyone.

It looks like the stock market is on the cusp of excessive optimism. That never ends well.  The guys behind the counter at my local UPS store were really excited about investing in BitCoins. Not good.

We will probably enjoy perhaps a year of continuing strong stock market returns.  My models say December should be excellent for the market and the following 5 months through May, 2018 should be OK, but not great.

However, the pieces are now in place for the next stock market crash. It won’t be soon, but it is now rather certain.  The great bull market it coming to an end. Don’t hold your breath.  As I just wrote, it probably won’t happen soon. Hopefully my econometric models will give us plenty of warning.

As of today, it looks like the Republican Party’s tax plan will be enacted in some form.  Much is unclear, but it is probably a sweet sugar-plum treat for many corporations and probably has not been fully priced into the stock market. Here comes a stronger sugar high, but the market has already been jazzed up on good news.

The economy is performing as good as can be expected. Literally.  The Congressional Budget Office, of course, is responsible for ‘scoring’ the costs and benefits of proposed legislation.  Many years ago as part of their scoring calculations CBO came up with a  remarkably accurate performance model for the U.S. economy. Here is a link to the long term CBO plot of that model going out to 2027.  The good news is that Real Gross Domestic Product has finally risen to the actual level of Real Potential U.S. GDP. The economy is actually doing quite well overall despite flat growth of wages and localized real problems in the Rust Belt and inner cities.  Real GDP may well go for years a bit over Potential GDP.  But, there is comparatively little upside room.  Possible GDP losses are now many times the level of near term potential gains.

Should the tax plan significantly spark the economy the Federal Reserve will almost certainly raise interest rates at a faster speed than their current course.  The Fed can, and will slow the economy to remove froth.  Unfortunately, for the past half century the Federal Reserve has not been able to bring the economy in for a “safe landing”.  Sudden crashes are the norm.

Finally, the Leading Index for the U.S. economy as posted on the Federal Reserve data website has decidedly turned down. Every time the fall has reached today’s level, the U.S. has gone into recession within a couple of years.

So, enjoy the good times while you can.  But, start preparing yourself for the letdown after the sugar high wears off.

Seasons Greetings.

(Click on image to enlarge.)

6 Month Stock Market Forecast: Strong start, then average performance

November 2017 through April 2018: 5% gains projected (about average)
November 2017: 2% one month expected increase (unusually strong)
Likelihood of at least breaking even: 80% to 95% (75% is average)

These stock market forecasting models remain bullish with surprisingly high projections for the coming month. The probability of at least breaking even is again considerably higher than average.  The Trump tax package could well falter and might take a bit of air out of the market. Beyond that the models still see no major mid-term threats to this bull market.

Personally, I expect November to be volatile since the GOP income tax bill is expected to be announced tomorrow. Whatever form it takes there will be possible winners and losers.  That should translate into stock market volatility.

I, however, will be a sure winner in the tax battle.  The flow of new lobbyists to Washington is going to be amazing.  There is nothing like the possibility of tax changes to get the K Street crowd hiring — not just the lobbyists themselves with their money sacks.  They all get backed up with lawyers, accountants, analysts, consultants and IT staff.   The airlines, hotels, restaurants, and hookers all will do great business as all the greedy or scared interest groups come to town for “vital” meetings.  Once started, tax wars go on for years and years. The market value of my DC house is gong to take a great leap!  Thanks guys!

The graph below shows the S&P 500 from 2007 with colored points overlaid to show the forecasts the models generated in real time.  Note that each point does NOT indicate what already happened in the market, rather each is the forecast for the 6 months that will follow the forecast. Look at the 6 months following each point to see if the forecast was on track.

Click on image to enlarge.