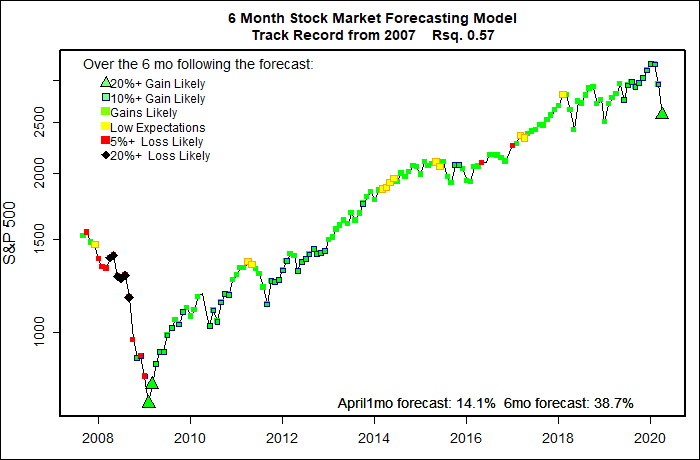
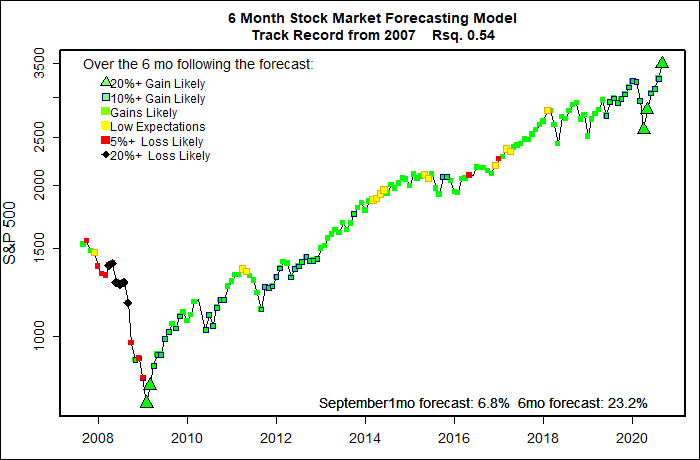
Forecast September thru February 2021: +23%
Probability of at least breaking even: 99%+
Probability of at least breaking even: 99%+
Since March, Coronavirus abruptly turned the economic world upside down. As that happened, I concluded that the forecasts coming from my statistical models would amount to no more than nonsense and rubbish. Rather than publish forecasts that might send my few readers astray, I thought it better to just not issue any projections. The economic world is still bizarre and nothing is normal, but at least there is starting to be new economic data that begins to reflect our new reality.
But, please don’t rely on what these economic models say now. This blog is written to document the results of these forecasting models in real time. The blog is not written as stock market advice.
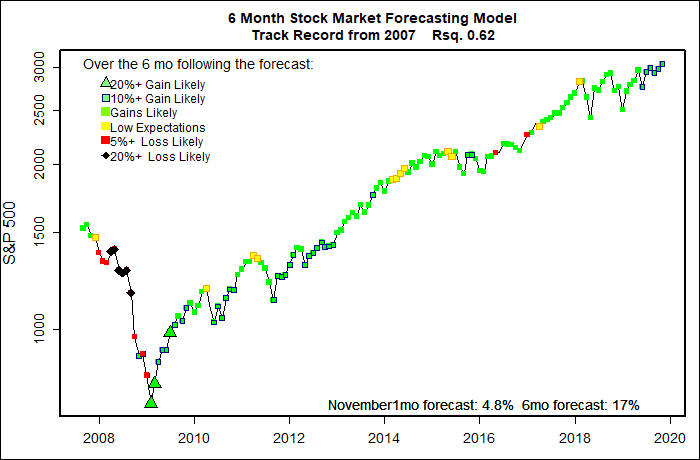
It turns out that despite economic data that bore little relation to reality, the models did an amazingly good job of predicting the stock market during this crazy period. My April forecast, posted as the stock market was still crashing, was for a spectacular 38% rebound by the end of September for the Value Line Arithmetic Average (VALUA), my chosen measure of the U.S. stock market. As of September 1 the VALUA has jumped up 42%. and the S&P 500 has gone up 35%. I should be jumping for joy — the models made an audacious major market call and even turned out to be accurate!
Events, of course, could have turned out differently. The only reason that the market rebounded and why things seem at all normal is that the federal government dumped roughly $2.5 trillion of economic stimulus on the economy. Likewise, the Federal Reserve System has reduced interest rates to near nothing, and committed to injecting $4 trillion into the financial system, in part through massive purchases of government bonds and also nearly worthless corporate bonds (airlines, car rental companies, etc.) All of this support was added in just about half a year! Even with all of this Helicopter Money, U.S. GDP dropped at an annual rate of 33%! That is the worst quarterly drop in the economy ever. Even with a partial economic rebound, more than 14 million people are still claiming unemployment benefits and new weekly unemployment claims are running at approximately 1 million. But, without all the massive and historic emergency economic aid all aspects of the economy would have been much much worse.
Things may still get much much worse. At least 180,000 people have died from this disease in the U.S., and the count is steadily increasing despite what our President says. Federal emergency spending has run out. Incredibly high unemployment benefits have expired and the Paycheck Protection Program that dumped free money on small businesses and their workers is over. The country is in the midst of a vicious presidential election. Congress is nowhere near an agreement on new stimulus, And wide availability of a coronavirus vaccine is still far away. When parents are afraid to simply send their kids to school, and any sensible older person is justifiably afraid to even go to a restaurant, visit with friends, or ride a bus, things are definitely still not normal. The situation could quickly get much worse, and it certainly will get much worse without additional federal intervention.
But, as I have said many times, my forecasting models are based not on what should happen, but on what usually happens. In the United States, what usually happens is that reluctantly, and a bit late, the federal government responds to any major crisis by dumping massive amounts of financial stimulus on the economy. As Winston Churchill was quoted as saying: “You can always count on Americans to do the right thing – after they’ve tried everything else.” For that reason, despite all the horrible economic possibilities, my models expect further increases for the stock market for the next half year. Will that happen? I don’t know.
Something to start worrying about.
If the stock market rallies further, the high fliers in the market will be moving into bubble territory. Stocks that have profited from the economic disruption of the pandemic have shot up to stratospheric levels. Stocks like Amazon, Apple, Netflix, Google and Facebook have benefited from incredible growth that might not continue.
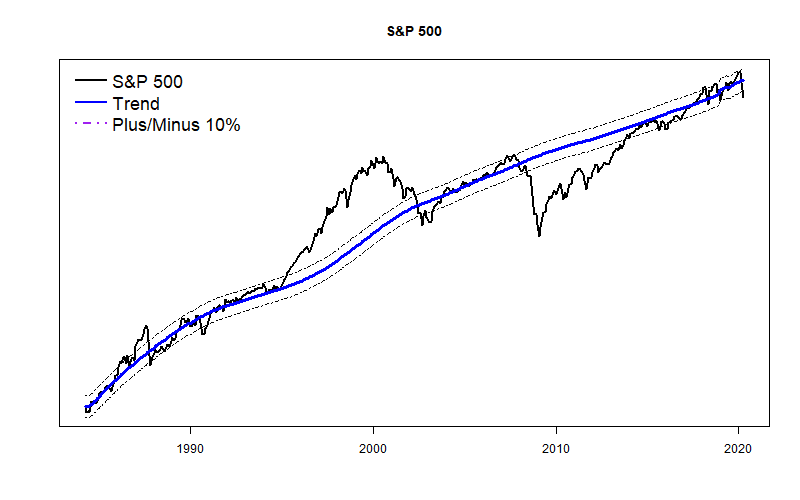
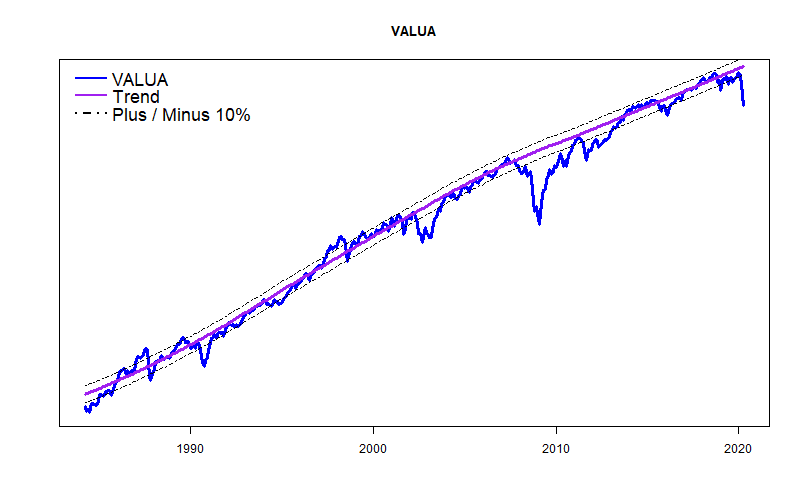
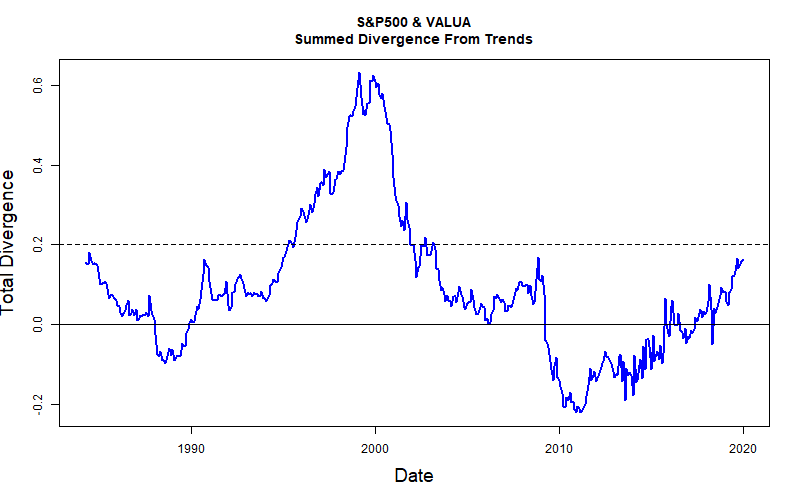
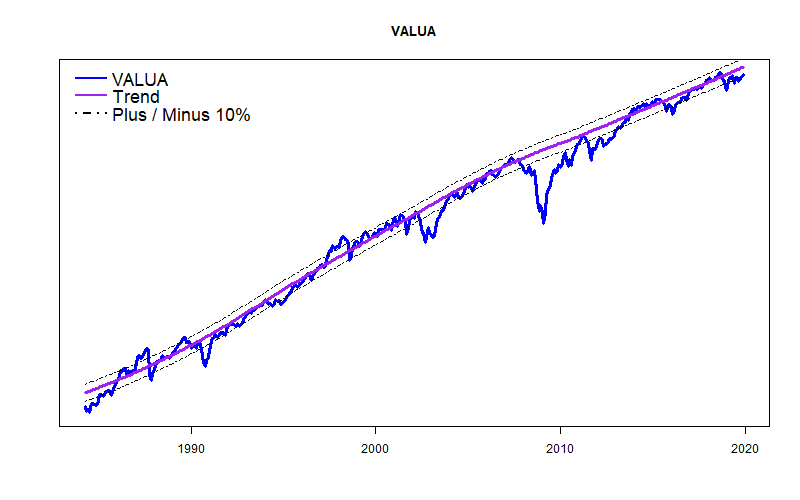
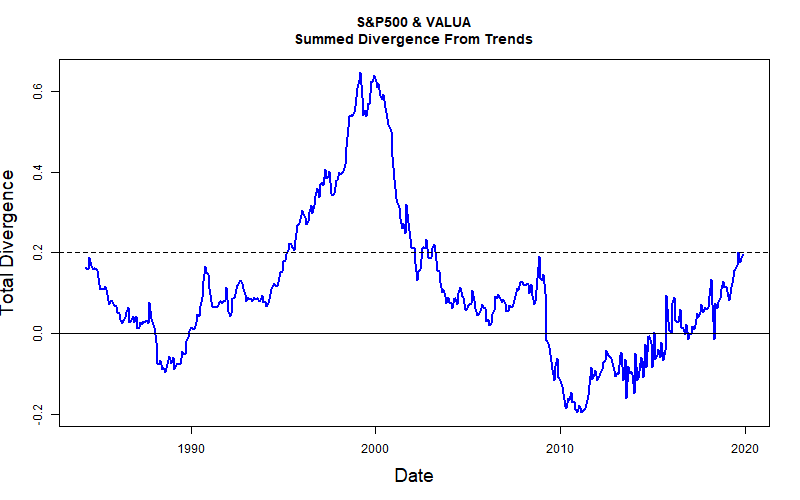
For years I have followed historical trend lines for of the Value Line Arithmetic Average and the S&P 500. Currently, VALUA is about 10% below its long term trend which makes sense given how rotten the economy is. Personally, I am surprised it is doing so well. The S&P 500, however, is about 10% above its historic trend line. When I graph the trend line divergence of these two indexes a scary picture emerges.
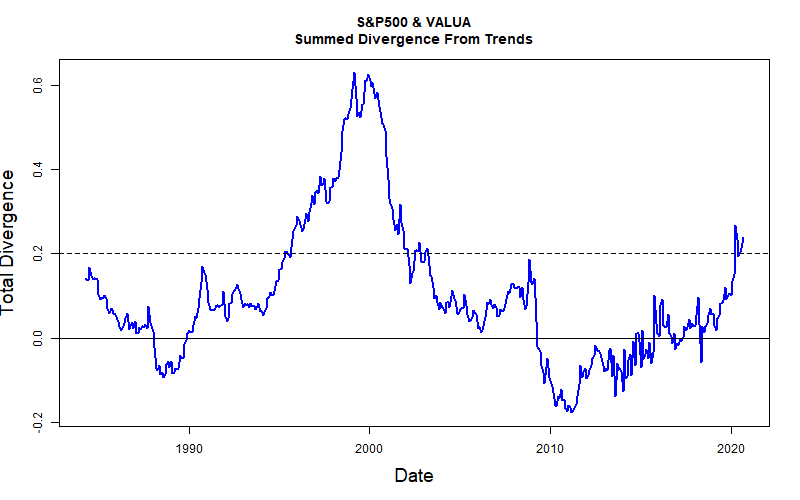
Since the market crash of the Great Recession the S&P 500 has been performing steadily better and better in comparison to VALUA. Now, the divergence has started to shoot up. The last time that happened was during the Dot Com Bubble.
I feel that, despite the favorable forecasts produced by my models, it is time to be a bit worried. The market has already priced in a lot of good news that has not yet occurred. A temporary stumble seems probable with so many loose ends. I believe there will be another buying opportunity before too long.
Good luck.