The statistical stock market forecasting models say: May thru October 2023: +7.8% (above average) Next 3 Months: Positive but weak. Both positive and negative alternative forecasts. Probability of at least breaking even: 92% (Range from 80% to 95% . Strong. )
The U.S. stock market forecast continues to brighten, and prospects are now distinctly above average. There probably will be gains over the next couple of months, but they are expected to be mild. In the later part of the summer, the models show some real strength. My concern is mainly focused on Republicans in the House of Representatives. They say they want a fight over the federal deficit, which will probably happen sometime over the summer. If the fight threatens government operation or the credibility of U.S. Treasury debt a sharp and probably temporary stock plummet would occur — I can’t predict that possibility. If they significantly reduce Government spending without a proportionate tax increase, the stock market will decline next fall or earlier. Federal spending is still stimulative (i.e. unusually high). If that economic joy-juice is taken away the stock market will certainly soften.
It is important to appreciate where we are starting from. Both long-term market trend graphs (below) show that the market is at or below trend. No bubble needs bursting (as opposed to cryptocurrency scams). Continued higher interest rates and less government spending potentially will dampen the market indefinitely.
The statistical forecasting models say: April thru September 2023: +6.9% (above average) Next 3 Months: Unclear. Both positive and negative forecasts. Probability of at least breaking even: 94% (Range from 86% to 99% . Strong. )
In recent months the market forecasts appear to be steadying out and are becoming more positive. This is a bit surprising. Typically, a stock market boom like we had over the pandemic begins with a decline that develops into a precipitous crash. Then, a characteristically sharp rebound occurs. That is not what has been happening and has not been what my models have been predicting. Put briefly: the Federal Reserve appears to be pulling off a smooth landing. Considering the scale of federal intervention that was required to keep the economy afloat during the pandemic confinement, the relatively smooth pullout that appears to be happening is nothing short of miraculous.
There will be further economic fallout as federal stimulus continues to ease. The bank failures of last month probably show how things will play out. Same for the significant round of staff layoffs that have been coming from big businesses. The inflation rate has been declining, but it is still much higher than the Federal Reserve considers acceptable. There still are plenty of problems in commercial real estate that have not fully come to light. Very real and very large economic problems are still at hand. There will be more pain and tightening. But, I remain amazed that things have been working out so smoothly. (Also, I don’t mind that my forecasting models have been unusually accurate.)
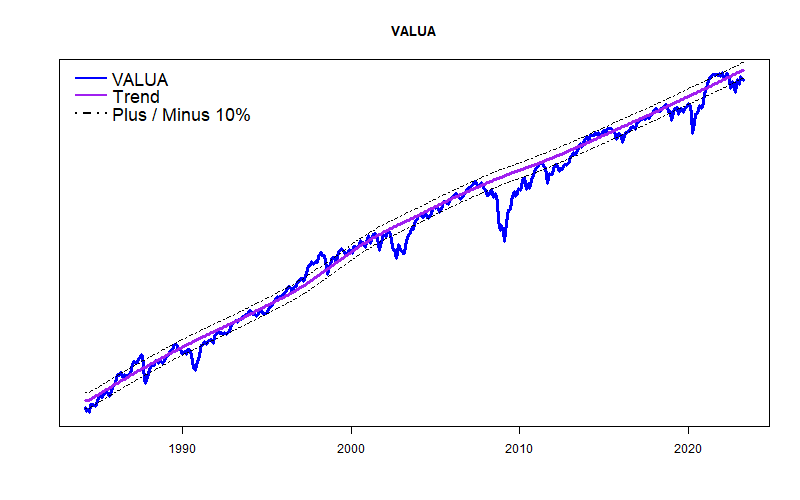
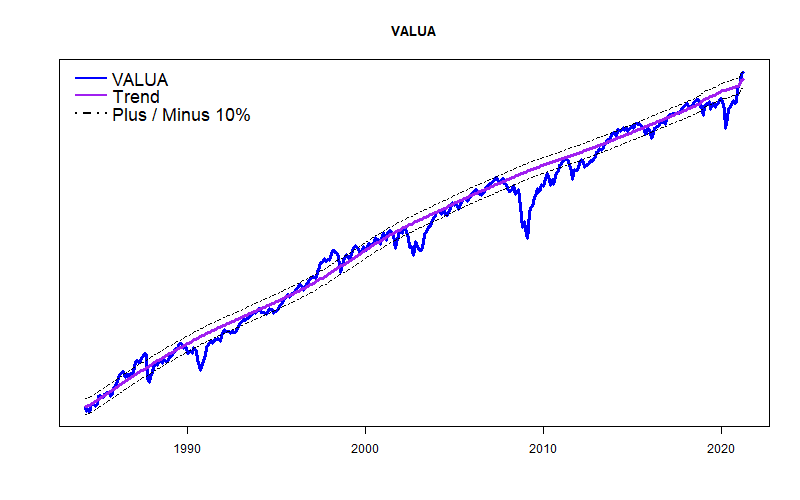
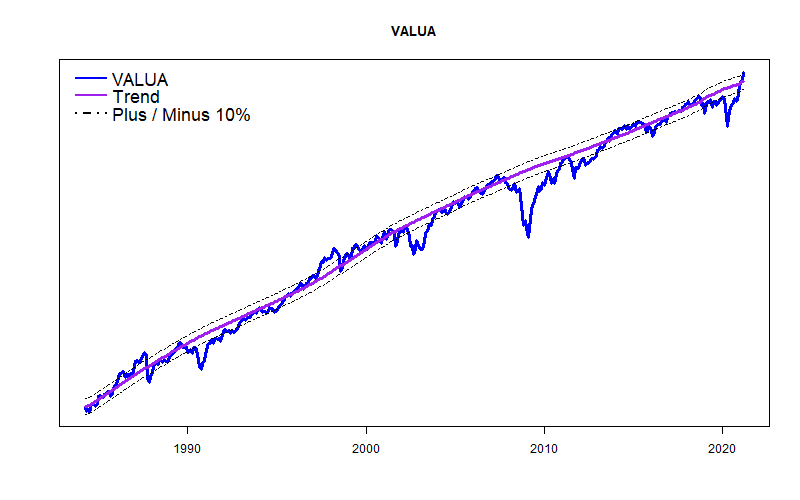
The primary market average that I track, the Value Line Arithmetic Average, is still moderately below trend. That is excellent news — there was no market crash and there is room for the market to rise further.
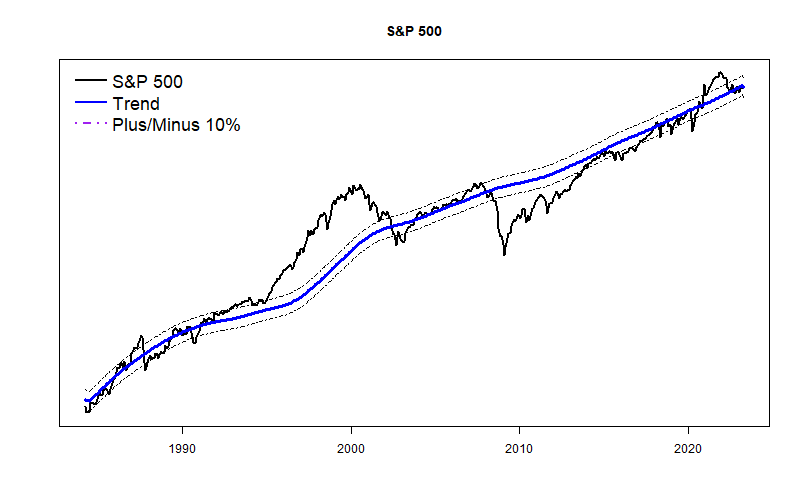
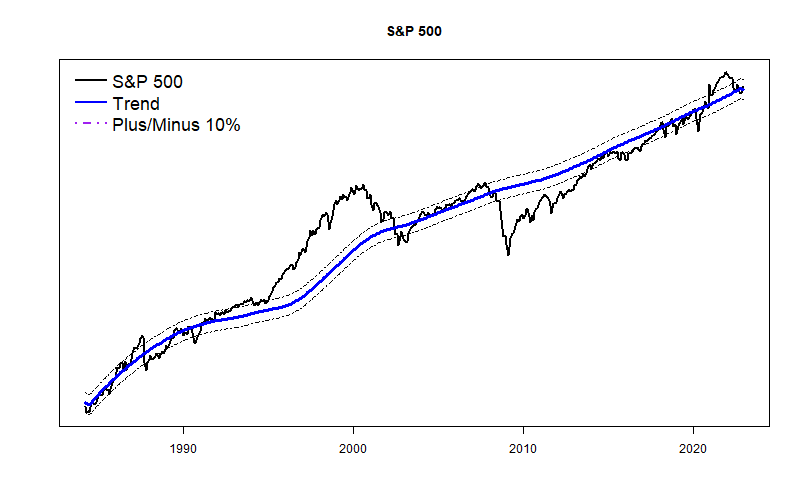
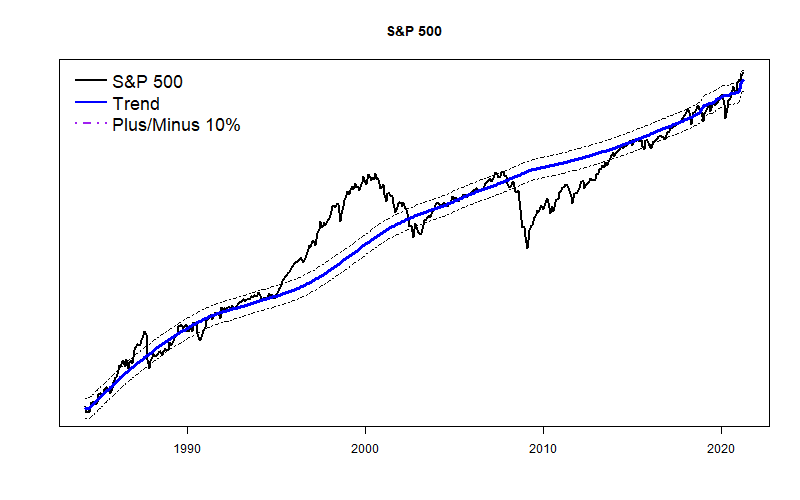
The S&P 500 average is almost exactly at it’s long term trend (at least, as I calculate it). I have been waiting for some sort of panic that would send the S&% 500 below-trend. The fact remains that it has held strong.
Considering that every other round fo Federal Reserve interest rate tightening has led to a significant stock market panic, I am still not breathing a sigh of relief. But, so far, so good.
The statistical forecasting models say: March thru August 2023: +3.7 (Slightly below average) Next 3 Months: 0% (Flat.) Probability of at least breaking even: 85% (Range from 55% to 85% . Meh. )
Hard landing? Soft landing? How about a delayed landing? The Federal Reserve mandate is to assure a stable monetary system and simultaneously to promote high employment. So far, so good. Unemployment remains down near a record low and inflation continues to fall slowly. The general expectation is the Fed will notch a couple more 1/4 percent interest rate increases, will pause, and see what happens, eventually starting to lower rates back down somewhat. Most market pundits fret whether the economic slowing will be mild (soft landing) or painful (hard landing).
The data I watch and my market models seem to be saying that this is going to be a drawn-out process — the economic landing is going to be delayed. This also should postpone a major market fall (unless World War 3.1 occurs, congressional Republicans really want to default on Federal debt, or another Black Swan pops up)
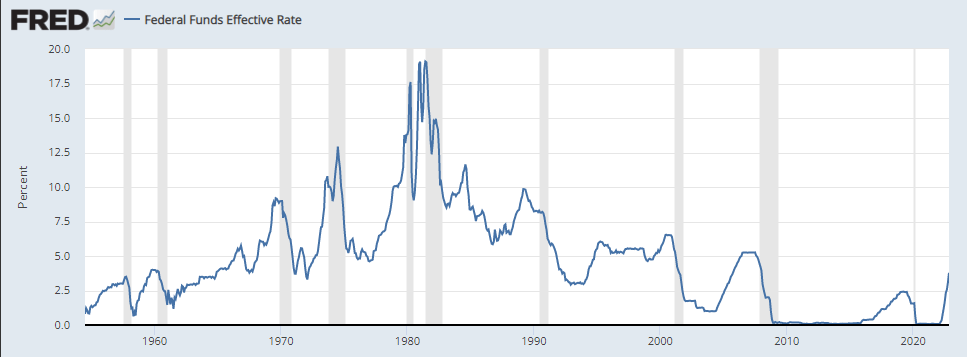
In 2022 with a series of 3/4 percent increases in the Federal Funds rate, the Fed sent an unmistakable message that it was acting to reduce troubling 9% inflation. Now, with inflation at roughly 5%, the message is equally clear that a slower pace of rate increases has begun. Simultaneously, the Fed has stalled increases in the money supply. But, this tightening remains very conservative.
Federal Government spending, however, is the other major factor affecting inflation and economic expansion. And federal spending will remain highly stimulative until at least the end of the current fiscal year, September 30. During the pandemic the federal annual deficit ran as high as 15% of GDP — no surprise inflation developed. Now it is down to about 5% of GDP, much less, but still strongly stimulative, and not coincidently about the same as the inflation rate.
With the presidential election round just starting, my bet is that neither party wants to be blamed for bringing on a recession. Both will posture that they want to do the right thing (whatever that is). But, both will hold tight to the populist creed of high spending and lower taxes.
Will the Fed be forced to tighten up to an extreme level? Or, will it hold off some until the election silly season passes? Don’t know, but this is a question for next fall or beyond.
The statistical forecasting models say: February thru July, 2023: +8% (Better than average) Next 3 Months: 1% (Ordinary.) Probability of at least breaking even: 98% (Excellent)
For the moment, the broad ‘value end’ of the stock market (as I measure it) is roughly 10% below where it “should” be. There is room to go up.
There are still plenty of worries..
Interest rates will continue to increase.
The full impact of interest rate increases takes about a year to appear.
Congressional Republicans clearly want a budget fight.
An unknown swarm of zombie companies could appear as pandemic aid finally drains away.
Workers have not all gone back to work. There are real fears for commercial real estate.
My standard models expect a significant stock market rebound, but models that consider Federal Reserve policy see a further downturn.
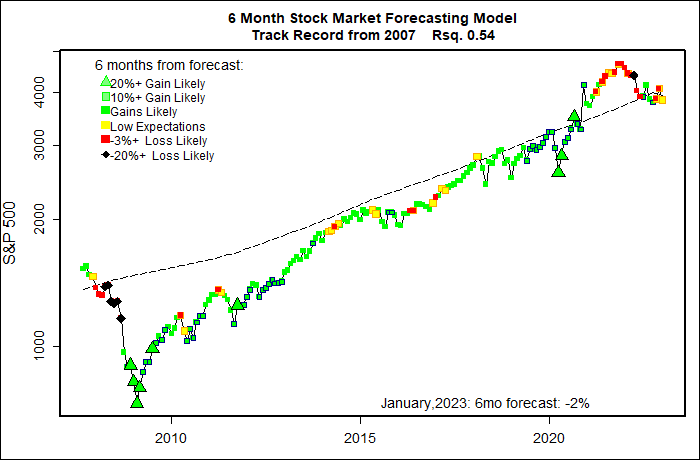
The statistical forecasting models say: January thru June, 2023: -2% (Wide model spread: -10% to +10%) Next 3 Months: ?% (0 to -16%.) Probability of at least breaking even: 26% to 99% (No clarity here.)
My simple market forecasting models like what they see. Stocks have gone down over 2022, so that makes a rebound likely. Stocks are near their long-term trend line – good! Gross Domestic Product is not overly inflated by pandemic stimulus – good! Interest rates are not so bad by historical standards. Inflation has receded some. The Federal Government will keep up deficit spending for at least most of 2023. Statistically, based on market experience since 1984, these models expect a rebound of +10%. Super!
Another group of forecasting models in my mix is fully aware the Federal Reserve has embarked on an inflation reduction campaign. These models see the stock market as being near very risky statistical situations during a rate hike process. These phase-attuned models are much more negative for the coming half-year, with forecasts ranging from -5% to -10% for the first half of the year. The related probabilities of at least breaking even are approximately 25% — quite low. We are getting nearer the point when market crashes can occur.
Making a decision difficult, the overall statistical accuracy of both models is equal. A market situation like we face now with rapidly rising interest rates is unusual — and the past examples (1987, 1998, 2000, 2007) had financial crises that became the focus of attention. I will be surprised if a crisis does not develop this year due to international financial instability, Congressional budget stalemate, or commercial real estate bankruptcies.
In the meantime, my best guess is that the U.S. stock market will try to stage some sort of rebound during January.
The Everything Bubble is deflating smoothly, and that’s the good news. The bad news is that inflation remains at about 7%, and the Federal Reserve will keep raising interest rates and tightening credit until inflation is in the vacinity of 2% to 4%. Some sort of stock market crash typically is part of this process.
Stocks fell last year by about 15% and they may/may not have further to go; that is what my economic models are supposed to figure out. My models, however, are not good about forecasting market effects of true economic surprises — black swans — that may appear as the bubble continues to go down. There may be a few on the horizon. I have no informed judgment on whether these birds will attack, or simply fly away. None appear to create immediate peril. I am a bit concerned about September….
No stock market bubble here. My long term trend line for the S&P 500 indicates that a stock market price bubble had inflated over the pandemic years. Massive government stimulus was the medicine the country needed to get through the economic chaos that the corona virus brought on. Thanks to that flood of money the economy survived and we all should be grateful. The stock market bubble and high inflation were two of the side effects of the massive economic stimulus.
Last year’s rapid interest rate increases by the Federal Reserve let the air out of the U.S. stock market bubble, now leaving the market right where it ‘should’ be based on interest rates and long term GDP projections. Stocks may need to a bit decline further if interest rates are going to remain higher. Higher rates would lower the long term trend line somewhat.
High government spending , lingering supply disruptions and a tight labor market may cause the Fed to overshoot. The massive omnibus federal spending package just signed into law means the Treasury remains in strong stimulus mode through September when the fiscal year ends. FY2022’s deficit will be roughly $1.71 trillion, about 7% of GDP, a major economic stimulus. That is much lower than the FY2021 deficit of $2.8 trillion, but it will still keep up employment in a number of areas (especially defense and energy) and push prices up for a variety of goods and services.
Wages and salaries are also staying quite strong. The chart below shows year-over-year percentage growth of wages and salaries. While down from the highs of the pandemic stimulus period, recent compensation increases remain at distinctly high levels.
The graph clearly shows that the pressure of rising wages has declined. But, about 3.5 million people are missing from the labor force, compared with what one might have expected based on pre-2020 trends, Jerome H. Powell, the Fed chair, said during a speech last month. Some commentators are concerned that retiring baby boomers may have caused a permanent decline in the labor supply. Others are concerned that even before covid, large numbers of people, especially men, have simply dropped out of the labor market.
The stock market concern here is that continuing economic strength, high energy prices, lingering covid-19 after-effects and worker shortages may force the Fed to raise interest rates more than otherwise and might send the economy into a significant recession — sparking a stock market sell-off.
Republican Congressional Brinksmanship The end of the Federal Government fiscal year September 30 could well bring on a classic display of sudden fiscal responsibility by House Rebublicans. Republican leader Kevin McCarthy is already raising cries against a gaping deficit. With the Presidential election cycle starting to gear up, it would be amazing if House Republicans did not stage one or more episodes of threatening to close, or actually closing the Federal Government. Wall Street has watched this theater act many times, but occasionally, as in 2011, fear grows enough to make the market plummet. Quickly cutting federal spending would guarantee a market crash.
Foreign Financial Disruption According to the International Monetary Fund, median global GDP dropped 3.9% from 2019 to 2020, the worst drop since the Great Depression, and that drop is beyond all government stimulus measures. While economies in most nations have recovered like the U.S., questions remain about the abilities of other nations to cope with the continuing economic fallout from covid-19. The strong position of the U.S. Dollar caused by the Fed’s rate hikes has put heavy strains on many other governments. Likewise the war in Ukraine puts a major question mark on the economies of Western Europe.
I have no idea how all of this will play out, and for a long term investor it shouldn’t really matter. Next year at this time the market will probably be fairly near its long term trend line again.
The “Everything Bubble” is starting to pop. Worldwide. It will take tiime, not be painless, and probably will include a stock panic of some sort.
First, there was The Great Recession Around the world, countries fought the economic collapse of the 2007-2010 “Great Recession” with massive economic stimulation, mainly in the form of historically low interest rates –near zero — and massive quantitative easing. There were also umprecedented government spending increases and tax cuts, but central bank actions were the prime movers.
Low interest rates are a stimulus technique for the ages. But, the near zero short term loan rates adopted during the Great Recession had never occurred before. Bank “Reserve Requirements” set by the Federal Reserve to promote responsible lending were eliminated as well.
Quantitative easing was a new addition to traditional government stimulus programs. Collapse of ‘subprime’ home finance loans in the housing speculation collapse of 2007 made trillions of dollars of supposedly safe bonds — mainly on the U.S. — either worthless or questionable. In the U.S. the Federal Reserve simply bought up all the bad debt. There was no other realistic option. As a result, Federal reserve holdings suddenly rose from around $900 billion dollars (not chump change) to $2.5 trillion in 2010, and to keep the ball rolling, Fed kept buying junk bonds until assets leveled off at $4.5 trillion in 2016.
Total U.S. Gross Domestic Product is now $23 trillion. So, all of a sudden, the Fed was holding highly questionable long term debt worth about a quarter of the U.S. economy annual output.
Ben Bernanke, chairman of the Federal Reserve at that time and a student of The Great Depression, fully supported the concept of dropping helicopter money — doing whatever was necessary — during extreme economic emergencies. To deal with the Great Recession both the Federal Reserve and the U.S. Congress, Republicans and all, shut their mouths, held their noses, bit their toungs, and, in short order, did what ever they had to do to get past an economic calamity that easily could have been worse than the Great Depression. They did what they did because there was no other option. Things were that bad.
By 2017 the Federal Reserve decided that it could start to reduce the stimulation of near-zero lending rates and to slowly, very slowly, start selling off the $4.5 trillion in long term bonds it had been forced to purchase. They probably waited too long — the Everything Bubble had started to inflate.
Then came the Covid Pandemic Within a couple of months beginning in December, 2019 the novel corona virus opened a worldwide pandemic. Much was unknown, but it became apparent that covid, with a mortality rate of about 2%, was a different beast than the annual influenza with its mortality rate of about 0.05%. Flu is th #9 killer in America. but it was, and remains, a joke compared to the early versions of the corona virus. Even today, covid has a mortality rate of nearly 1%.Total U.S. losses to covid are well above the total number of American soldiers lost to all U,S, wars from the Revolution to today.
In the first and second quarter of 2020, the U.S., and the rest of the world, suffered an econonomic collapse more sudden and severe than any ever before. Grocery stores were near empty of many staples from toilet paper to laundry bleach. Whole economic sectors like retail, tourism, airlines, instantly were not just suffering, but totally bankrupt. Airlines. for example, are highly leveraged businesses; compared to profits, their overhead expenditures are huge. With no prospects of flying again for months the airlines were immediately bankrupt. First, the airlines would collapse, then the firms that lent money to the airlines, then the owners and firms that lent money to them. Then…. It was a classic domino chain event.
Much like 2007. central banks and governments around the world pulled out all the stops, dropping interest rates — in a few cases even below zero — and dropped trillions of dollars in helecopter money unlike anything ever seen before. The Republican Trump administration was suddenly sending out checks for thousands of dollars to just about everyone. No strings attached. Trillions of dollars in spending programs. Helicopter money pure and simple. As shutdowns and cutbacks from covid continued, the new Democratic Biden administration kept the money flowing.
And thankfully, all that money falling from the sky did its job. Vaccines were developed. The new strains of the original virus were both weaker and more contageous. People changed how they interacted. People could get back to work. We survived.
We survived, but as in fighting all wars, there was a heavy debt that must be paid.
The Federal Reserve now owns roughly $9.5 trillion, half a year of U.S. GDP.
The “Everything Bubble” collapses. With interest rates incredibly low — unlike ever before in history — buying demand went up. But for things in limited supply (oil, housing, gold, labor, whatever) prices rose according. So, very suddenly, nearly everything was in bubble mode. Just like the Dot.Com Bubble, mere imaginary figments like crypto currencies and non-fungible tokens suddenly became prized assets. Real assets like stocks and housing spiraled in price as well. For a while an awful lot of people around the world got to feel like very smart investors. That is never a good sign.
Inflation is starting to fall because of tighter money supply, higher short and long-term interest rates, and easing of pandemic and Ukraine spurred shortages. As required by its charter, the Federal Reserve is using the few, but powerful tools it has to tamp down inflation, hopefully without destroying employment. Inflation had shot up to roughly 9% annually (now down to 7.1%). The Fed target is an ongoing inflation rate of roughly 2%, but the Fed would throw a staff party if it even got near 3%. The process has far to go. It took roughly two years for inflation to jump so it may well take two more years for it to decline and stabilize.
Short-term interest rates sharply up nearly 4%. This is already as much of an interest rate increase as the Fed typically has used in the past to damp down the economy, but it has never raised rates so fast. Another point up or so seems likely but in smaller increments.
Higher Long Term Interest Rates Mortgage rates have generally been falling since the highs of 1980, and then sank to unprecedented levels during the pandemic. Only recently have long term rates started to shoot up again.
Expect a slow motion train wreck. Though cooling, inflation remains near 7%. The Federal Reserve will not turn around until inflation nears the target or the economy goes in to a crisis. Knowing that interest rate changes have a time lag of about a year, the Federal Reserve will typically raise rates and then pause further action until the economy’s reaction becomes clear. But, the fed still expects a couple more interest rate increases before pausing this time..
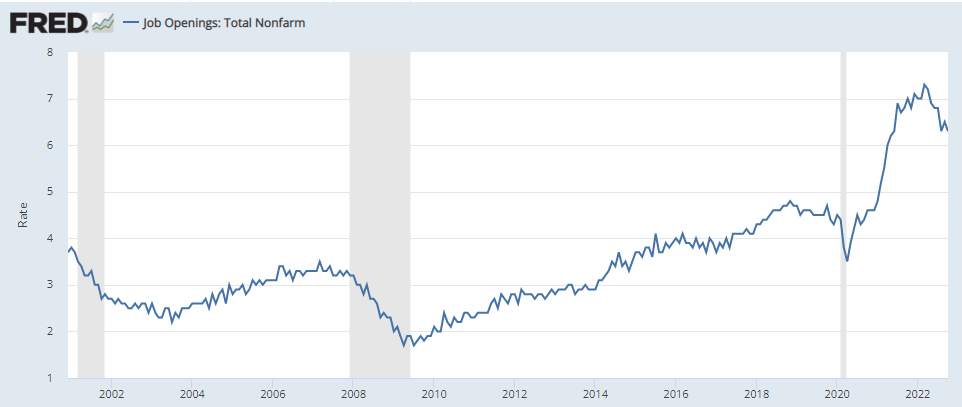
In its most positive view, the Federal Reserve expects Real GDP growth of just 0.5% in 2023 — very near a recession. My back-of-the-envelope calculation is that, though the Case-Shiller U.S. National House Price Index has fallen a few percent, house prices still needs to drop 10% to 15% more. Job Openings have fallen a bit, but remain incredibly strong — for now. Unemployment, still rock bottom at 3.7%, will probably double.
Finally, corporate profits are still well above a solidly established long term trend. Profits margins will shrink and profits down. Price/earnings levels that seemed realistic through the pandemic years will start to look frothy.
In the words of Warren Buffet: “Only when the tide goes out do you discover who’s been swimming naked.”
One bit of good news is that it does not appear that the stock market requires a major contraction. My long-term trend line for the S&P 500 says that the market had been in a small bubble over the past couple of years, but the tough times of 2022 brought the market back to near the long term trend. In the Dot-Com era, prices were ridiculously above the long term trend and sadly years of major downturn and over-correction were required. This time, the market situation is much more like 1987 or 2007 — in those situations the stock market was near trend and other sectors — principally real estate — required major correction.
Though the U.S. economy is strong and the Federal Reserve is doing exactly what it is supposed to do, the next year will be difficult and filled with worry. Periods like this are ripe for stock market panic. Every time the Federal Reserve has campaigned against inflation a stock market crash has occurred.
My next post will look at likely triggers for stock market panic and discuss whether my models are likely to forecast correctly any market crack up. I have my doubts.
Next 6 Months: -3.3% (No big deal. Models vary from +2% to -9%) Probability of at least breaking even: 50% – 80% (Meh.)
Back to publishing
During the pandemic I felt it would be a disservice to publish any forecasts. My models are statistical, based on the assumption that what usually happens will usually happen again. At least sort of. But, the pandemic hacked apart the normal economy, and the intervention by the Federal Reserve and the U.S. Treasury was incredibly massive. The financial intervention saved us from immediate financial destruction, but it made a joke of my silly little econometric models.
We are now in something of a post-war situation, trying to get the economy back to a more normal footing. Certainly high inflation, rising interest rates, and residual supply chain questions are real problems, but they are things the economy has faced many times before.
Going forward, as far as I am concerned, something like what usually happens will usually happen again. Phew.
One administrative note: during the course of the pandemic Google dropped the Feedburner service that had sent out subscribers notice each time I sent out a new post. I am not sure whether the new subscriber widget with MailChimp works. Please feel free to email me in the meantime at TomTiedeman@gmail.com.
Stocks Near Long Term Trend
The first chart shows the S&P 500 plotted with a long term performance model based largely on interest rates and Real Potential Gross Domestic Product. It shows that after flying above normal during most of the pandemic it has returned to fairly near normal
(Click on image to enlarge.)
After bubbling a bit during the pandemic, the SP500 average is now rather near what I calculate as its long term trend.
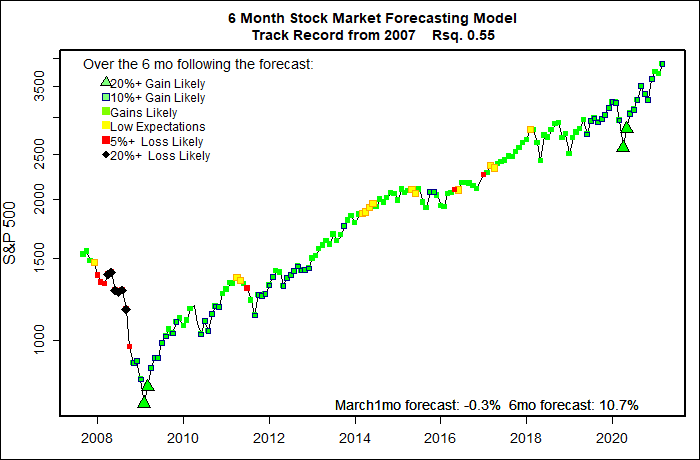
Weak First Half Year
(Click on image to enlarge.)
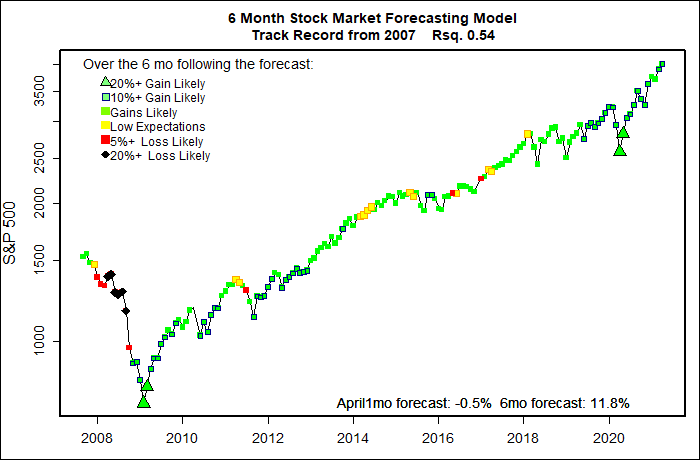
The chart above displays six-month market forecasts since I started publishing in 2007. Note that each dot reflects the forecast for the 6 coming months, so the red negative forecasts from the peak of the pandemic months are really pretty good — the market did in fact go down. Six month forecasts have again started to turn negative, but my short term models expect the year to probably start out fine.
Next 6 Months: +11% (Flavors of the model vary from 7% to +15%) Probability of at least breaking even: 82%(Flavors vary from 59% to 97%)
Don’t fight the Fed.
My several stock market models are in basic agreement that the Federal Reserve and U.S. Treasury are controlling the path of the stock market. Massive deficit spending from the U.S. Treasury and never-before-seen liquidity and low interest rates from the Fed have been keeping the economy and the stock market alive and will keep doing so for the foreseeable future.
By analogy, the economy has been totally reliant on life support for the past covid-dominated year. Without all the stimulus the patient would have died. In the best case, the stimulus will gradually taper off and the patient will emerge from Intensive Care to hear cheers from all of us.
Continuing the Intensive Care analogy, only about 20% of covid patients on ventilators survived. Unfortunately, there will probably be areas of the economy that will have lingering damage — commercial real estate being a likely casualty. I remain concerned that a side effect of the stimulus and ‘seeing the end of the covid tunnel’ will be a major stock market bubble that eventually pops. But, for the moment, the market is likely to continue to increase. The odds of the market at least breaking even over the next six months is about average. I expect increasing volatility over the summer months.
Tracking the Long Term Trend
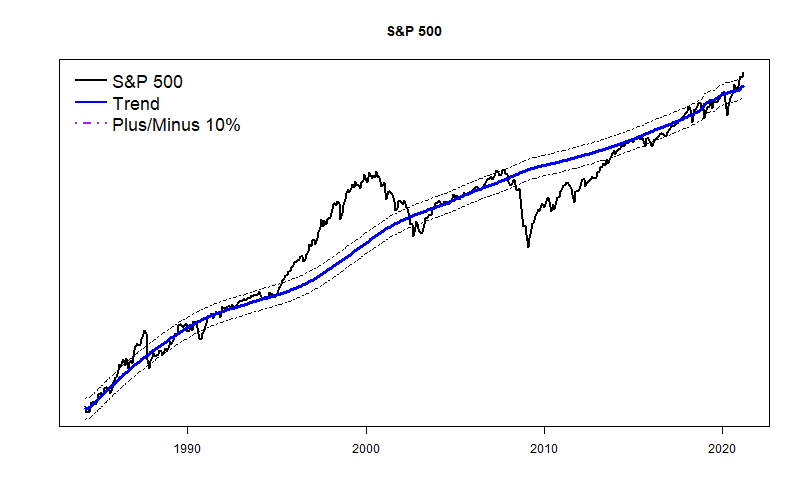
Both the S&P 500 and the Value Line Arithmetic Average remain somewhat more than 10% above their long term trend lines. (Trend based on a model that factors in Real Potential GDP and interest rates.) Likewise the Morningstar.com Fair Market Value Graph estimates that stocks as a whole are about 10% above fair market value.
In normal markets this 10% overvalued level signals that the market is due for some sort of correction. Breaking much above this level will confirm a true market bubble. So far, we are seeing froth, but not yet a major bubble.
Something very unusual has been happening over the past few months: the boring mainstays of the economy have been leading the way. For most of the past year glamorous tech stocks (Apple, Google, Facebook, Netflix, Amazon, etc.) have been shooting up like rockets. Now, the rest of the market that is catching up.
Next 6 Months: +10% (Flavors of the model vary from 0 to +20%) Probability of at least breaking even: 78%(Flavors vary from 40% to 99%)
It is very hard to forecast a volatile thing like the stock market even in a good year. We haven’t gone through a ‘good’ year; it was a horrible year on so many levels and in so many ways. When the primary adjective you hear in most news stories about just about any subject is the word “unprecedented” making a forecast about anything is hard.. Everything about 2020 seems to have been “unprecedented”. I am sick of that damn word. How about, “unpresidented”?
It is now a full year since the pandemic hit the U.S. like a giant sledge hammer. The world economy was knocked unconscious and was put on intensive financial life support through massive government financial intervention. Simultaneously, several of the respected data series that support my models were either discontinued, disappeared from publication, or became otherwise suspect.
The net effect of all of the pandemic-caused economic disruption was that several components of my economic forecasting models were essentially blown apart.
However, the major (the most powerful and statistically reliable) components of my forecasting models came though the storm surprisingly well, and I have finally finished with a series of repairs and work-arounds. It remains to be seen how well my modified forecasting models behave, but I am fairly confident that they will report “what usually happens” as financial and economic changes occur.
(Click on image to enlarge.)
Bubble in progress
The long term trend graphs for both the Standard & Poor’s 500 and the Value Line Arithmetic Index are both about 10% above normal. If you scan the graphs below it is clear that markets seldom stay this far above trend for long. The glaring exception, of course, was the DotCom Bubble of 1998-2001. I think that sort of market bubble is happening again.
Some flavors of my models are already fretting about the frothy market and are turning more and more negative. However, given the $1.9 trillion recovery package that has been signed into law (about 10% of GDP) and also given the dovish stance of the Federal Reserve, I highly doubt that the stock market will crack any time soon. To me it appears that we are in the early stages of a major stock market bubble.