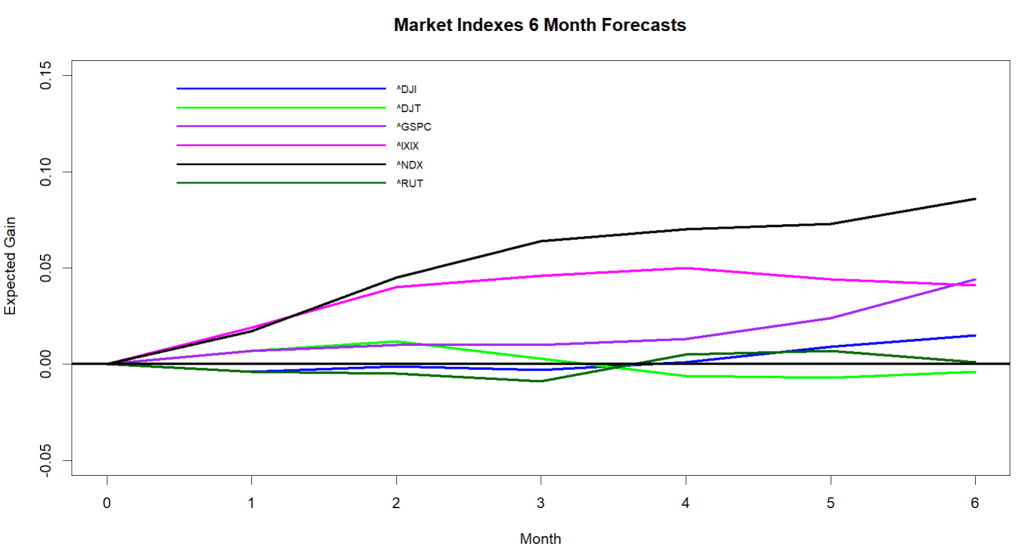
As the spaghetti chart below shows, my forecasts for most market indexes remain mildly positive. Technology stocks such as the NASDAQ 100 (^NDX) should stay in the lead while smaller stocks of the broader Russell 2000 (^RUT) are expected to bring up the rear. Looking out 6 months, the prospects are not as bright — probabilities of gain are looking weakish and the 6-month forecast for the Value Line Arithmetic Average is expected to drop by about a percent.
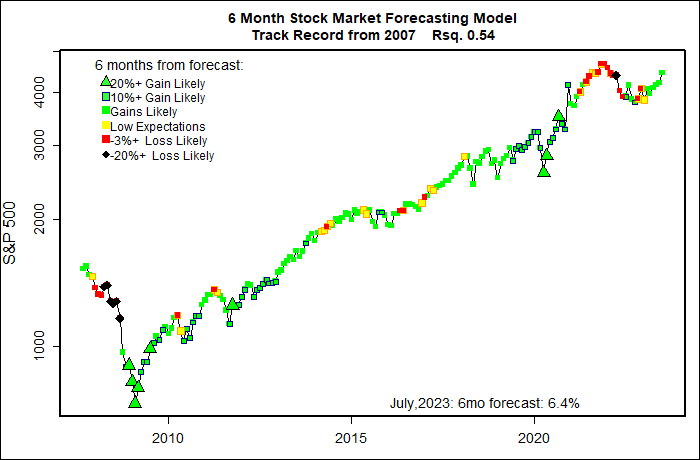
This calm forecast is striking evidence of the economy coming in for a soft landing following the Federal Reserve’s strong anti-inflation campaign. This is normally the point in the economic cycle when the stock market crashes. The high unemployment and corporate profit destruction that usually follows major interest rate increases simply have not happened — a so-called “Immaculate Disinflation”.

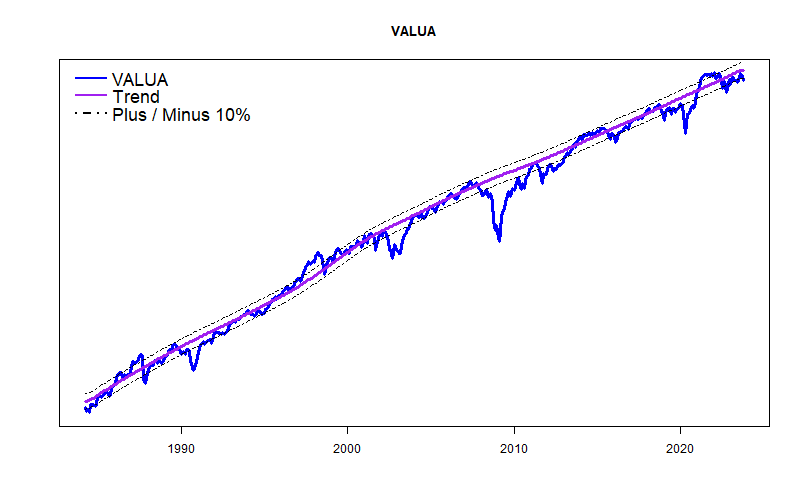
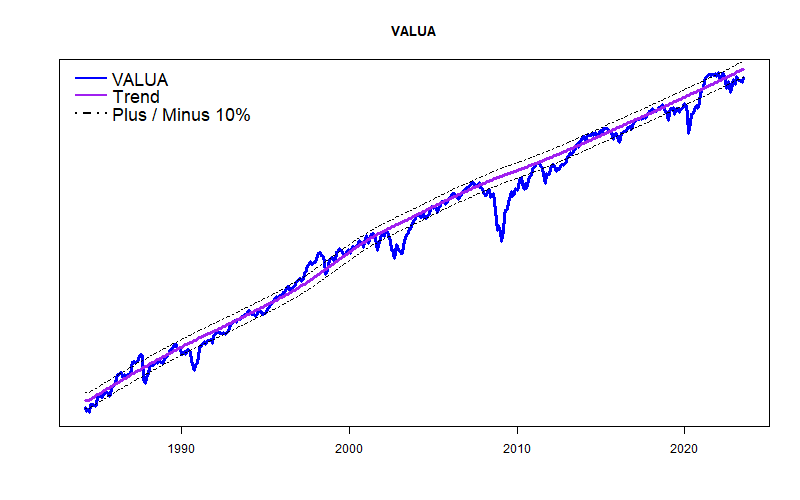
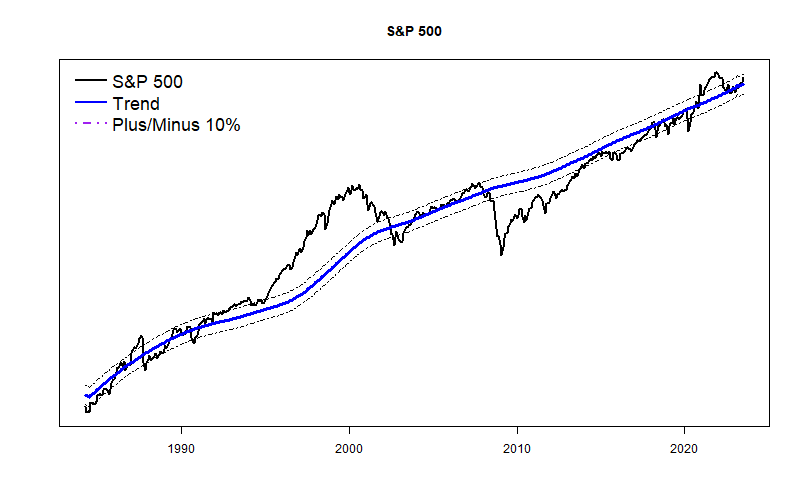
The growing split between the high-flying technology stocks and the main economy also shows up in my long-term trend plots of the S&P 500 and the Value Line Arithmetic Average. The S&P now appears to be distinctly higher than normal while VALUA is showing weakness. Neither of these trend divergences, however, seems to be concerning. Yet.


Hopefully, the Alpha Test of ETF forecasts concludes this month, and next month it can transition to a somewhat more credible Beta Test. The 6 month ETF forecasts are proving to be mathematically fairly accurate. The 1 and 2-month forecasts are not showing high accuracy, but they certainly are much better than any of the fruit of “Technical Analysis”.