The Morningstar.com Market Fair Value graphs , updated daily since 2001, provide an objective assessment whether the U.S. stock market is over-priced or underpriced. What’s more, there is no charge to view the graphs and they appear to have a remarkable track record.
Morningstar. com describes their proprietary Fair Value assessments as follows:
” At Morningstar, our analysts estimate a company’s fair value by determining how much we would pay today for all the streams of excess cash generated by the company in the future. We arrive at this value by forecasting a company’s future financial performance using a detailed discounted cash-flow model … that factors in projections for the company’s income statement, balance sheet, and cash-flow statement. The result is an analyst-driven estimate of the stock’s fair value.”
The Morningstar.com Market Fair Value graph sums up the individual company ratings several ways:
- All rated stocks
- Sector
- Super sector
- Industry
- Fair value uncertainty
- Index (NYSE, NASDAQ)
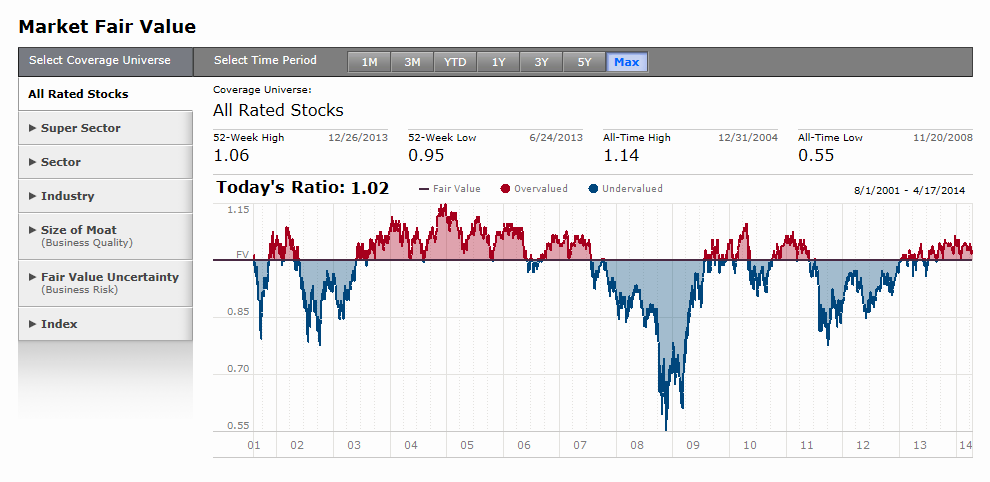
I use a simple reading of the Morningstar.com Market Fair Value charts. I concentrate on the “Max” time setting for “All rated stocks” in order to get an overall perspective of market valuation over the past few years and months. If the current rating is near fair value (1.02 today) I go back to drinking my morning coffee. If the rating is more than about 1.05 I worry that the market is getting pricey, and above 1.10, I think seriously about cutting back on stocks. A rating below 0.85, which seems to occur every few years, gives me good confidence that stocks are in “buy” territory.