One Month Stock Market Forecast January, 2018: 0.7% gain ( near average)
6 Month Stock Market Forecast January thru June, 2018: 4% (somewhat below average)
Probability of at least Breaking Even: 0.9 (above average)
What am I doing? Staying fully invested with no clear reason to leave.
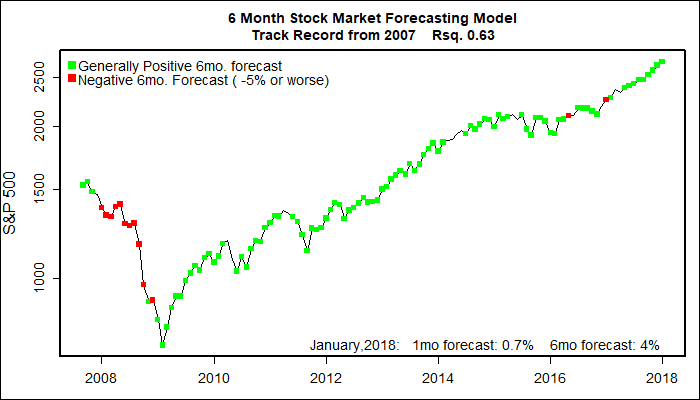
My stock market prediction models expect U.S. stocks to grind higher through the first half of 2018 with roughly average gains. The tilt of the market remains positive with the probability of at least breaking even in the first half of the year at a strong 90% (compared to the long term average of about 74%).
Though the predictive models expect January to produce some gains, I have my doubts. The market produced spectacular gains through 2017, and as a result investors held on to their gains through December. (Who wants to pay tax for stock sales in 2017 when they can stall taxes for another year?) With the start of the new tax year I expect some nervous investors will want to ditch some stocks with lofty valuations during January.
MorningStar.com calculates Market Fair Value By Sector here. Currently they consider the market to be roughly 6% above Fair Market Value. Typically, a temporary retrenchment toward fair value follows before too long.
2018 Outlook
Hopefully, the first half of 2018 will, in fact, play out as favorably boring. That is the best possible outcome.
If the market really surges in the first half of 2018, the second half of the year could see the market take a significant hit. (Just a personal opinion, the models do not see that far out.)
Higher corporate profits stemming from the Republican tax cuts may well kick in at just the wrong time fostering a market bubble that will be prone to pop.
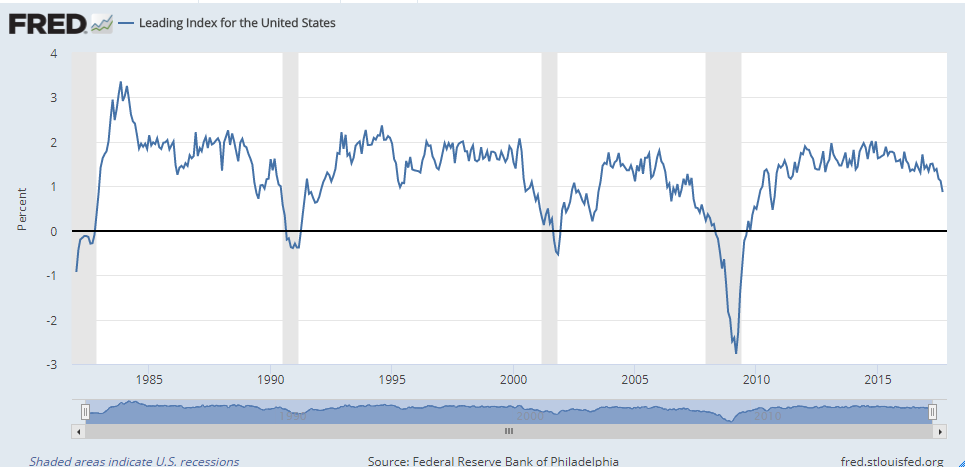
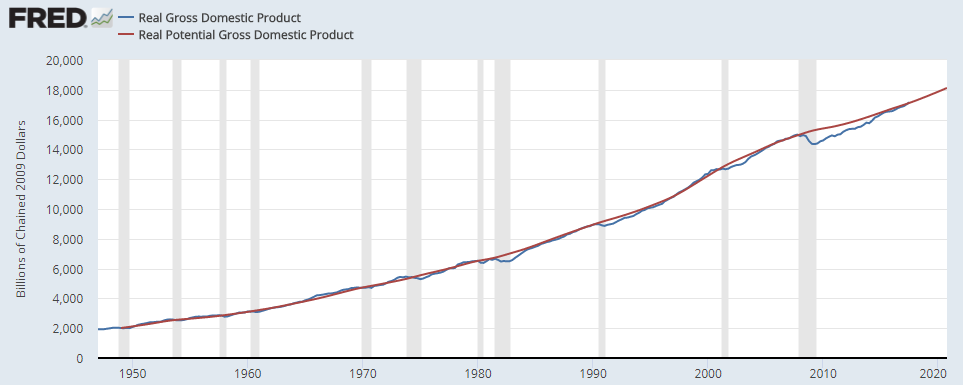
The U.S. economy is already doing quite well. Gross Domestic Product crashed down during the Great Recession, but has now climbed back up to what economists see as the true long term potential for GDP. Closing the gap with Potential GDP has been the principal force driving the stock market higher since 2009. Now the gap has closed. Prospects are now more limited.
There is little to worry about immediately. Near term prospects for a recession, key to a strong stock market, are very low according to several metrics. This is about as good as it gets for the economy. Anything better would be considered ‘overheating’.
As slowly, steadily, and as transparently as possible, the Federal Reserve has been raising short term interest rates. By also starting to sell off their huge portfolio of long term debt they are also hoping to nudge long term interest rates higher. Generally, these rate hikes have been expected and even welcomed as a sign that the Fed finally feels that the financial system can get off emergency life support and get back to normal. Interest rates are still very low by historical measures.
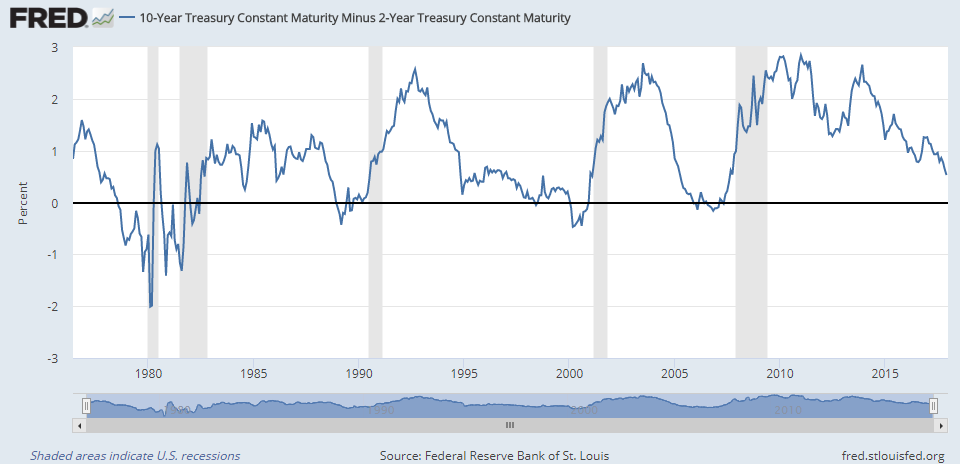
Potentially, if the Federal Reserve becomes concerned of the economy overheating, it could start to take the punch bowl away from the party in the second half of the year. It wouldn’t be hard — when short term interest rates are higher than long term rates, commercial lending freezes up, and major financial institutions get into jeopardy. The economy stalls . But, before that happens, the stock market crashes. That is the typical scenario for a major stock market crash.
As the next graph shows, there is still a safe spread between short and long term interest rates. This could last for years if the Fed wants. But, the end game is coming in to view. Watch to see this summer if the Fed becomes more aggressive in raising rates.
And then there are the mid-term congressional elections to unsettle the waters come summer. Just as the tantalizing prospect of corporate tax cuts provided a rosy back drop for the stock market in 2017, a major turnover in congressional power could wipe those tax cuts out going forward. A large number of unnecessary enemies were created in the Republican tax cut drive. A majority of Americans will be wanting change.