Category Archives: Uncategorized

Love Them Quitters!

SPOILER: People are quitting their jobs at a high rate, meaning they are not afraid about what is happening in the economy.  That is good news — while it lasts.

To create a major stock market crash you need to get a lot of people very frightened all at the same time. Put another way, if nearly everyone is calm, happy, and optimistic about their economic futures it is not likely they are all going to panic any time soon.  So, it is worthwhile finding an economic indicator that tracks the nation’s basic trust in the economic health of the country.

I like to track the number of people who quit their jobs each month.  Inherently people who quit their jobs are optimists. They voluntarily leave a somewhat safe job in order to jump into something else they hope and expect to be better. They are betting their whole future! Quitting a job is a very big deal. Most people will be cautious. If people are really worried about the economy, they probably will hunker down in their current job until times get better.

There are, of course, plenty of job quitters like new retirees and people with health problems who don’t fit the optimist profile. And there are a large number of seasonal quitters like college students giving up their summer jobs.  But, once you discount a baseline, the fact remains that a large, and probably fairly constant share of people who quit their jobs are showing a vital belief in a better future.

The government has been tracking unemployment since April of 1929. (Hmmm… The Great Crash happened in October, 1929.  Were economists already getting worried much earlier?) But, for stock market prognostication unemployment data is not all that helpful — it lags rather than leads stock market activity.  Businesses have tended to hold off on laying people off until absolutely necessary.

In 2000 the Bureau of Labor Statistics started tracking job quits on a monthly basis in their Job Openings and Labor Turnover Survey (JOLTS).  The data is available for free at the Federal Reserve Economic Data (FRED) website.  https://fred.stlouisfed.org

The monthly data has a great deal of repeating seasonality. Most quits are always in August. Least job quits occur in November, December, February, and March. (These graphs are interective.  Run your cursor over them and monthly values will be displayed.)

FRED also provides a seasonally adjusted version of the data.  It still shows a lot of apparently seasonal variation, but it is smoother than the unadjusted data.

This is a fairly new data series, so it is important not to jump to conclusions all that fast.

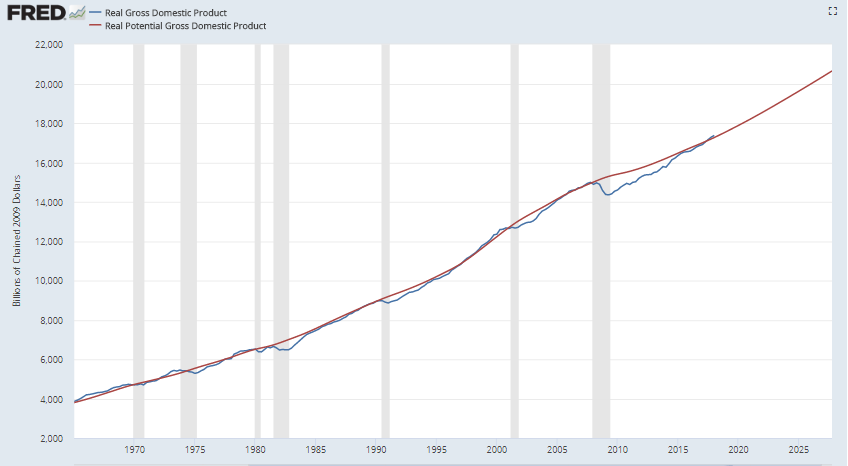
That said, Job Quits began to level off in 2005, well before the 2007-2009 stock market crash and well before the subsequent recession.

Current job quits are at a high level.  That is encouraging.  Should the rate of quits level off or decrease, it will probably make sense to worry a bit more.  (Also, don’t read too much into the data for February and March when job quits are seasonally very low.)

Stocks 2019 — Model Expects Some Recovery

The statistical forecasting model says:
January, 2019:  +1.3%  (Above average)
Next 6 Months: 8% (Significantly above average)
Probability of at least breaking even:  Well above average

Investors around the world are scared going into 2019.  The market declines over the third quarter of 2018 were fast, prolonged, and sharp. The great big negative facing the stock market is obvious: the Federal Reserve moves to raise interest rates are starting to slow the economy.  The real economy will probably get somewhat worse before it gets better. The spread in long term versus short term interest rates has become miniscule.  If short term rates rise above long term rates a significant recession is almost guaranteed.  There is good reason to be worried.

My forecasting model sees things differently.  The model polls a group of economic indicators that have track records of a half century or more of pointing to the moves of U.S. stock markets in the coming half year.  Together they estimate what the market is most likely to do based upon what the market has done in similar situations over the last several decades.

After a sharp decline such as we have experienced, the model expects the market to recover some.  Whether it goes on to set new records is another question, but the model says the market is probably not in the midst of a major market crash.  However, other than some degree of rebound, the statistical model does not spy the makings of a major new bull market.

A boring 2019 would be wonderful, but more likely we will experience a lot of volatility.

Happy New Year to both of my readers :o)

Stocks December 2018 thru May 2019 — Not Dead Yet

The forecasting model says:
December:  +1.9%  (Way above average)
Next 6 Months: 3% (Somewhat below average)
Probability of at least breaking even:  Well above average

Appropriately for the end of the year, I have both good and bad news to share.

The bad news:  The stock market is going to crash and we are all going to die. Sorry.

The good news: At least according to my statistical models, neither event is likely to occur in the near future. Finish digesting your turkey, I hope it was wonderful. Stay warm as winter comes on.  Try to be nice to at least one person who is worse off than you.  If you own any stocks at all there are billions of people in the world who are much worse off than you.  Be glad that the stock market is unsettled — volatility in the stock market is a very healthy thing.

(Click on image to enlarge.)

We are in the later stages of an historically long bull market — the crash of the Great Recession was bad enough to guarantee that the current bull market would set records.  Things were so bad, they could only get better!  Importantly, the Great Recession was bad enough so that a world-wide consensus developed that central banks needed to apply long term stimulus in the form of historically low interest rates.  It worked! For a couple of years now the U.S. Federal Reserve has been raising interest rates back toward more normal levels.  The speed at which the Fed has been increasing rates has been unusually slow and steady, and the Fed has been unusually forthcoming in stating that slow and steady was exactly what they were aiming for.  Other major central banks have been lagging — they are not so sure that everything is fine yet.

Big financial organizations make their money by borrowing short term money at very low interest rates (e.g. your savings account that returns almost no interest) and then lending that same money out at significantly higher rates (e.g. mortgages, commercial loans, and credit cards).  As long as short term interest rates are lower than long term rates, the game goes on.  But, when short term rates and long term rates collide, the whole economy shuts down.

The chart below shows the spread (the difference) between 10 year interest rates and 3 month interest rates in the U.S.  When the spread goes to zero or even turns negative, a recession surely follows with a time lag of 6 months to a year. Same story for the stock market which reacts to bad news faster than the economy.

As shown, for years the Federal Reserve has been raising interest rates (and reducing the spread) at an unusually slow and steady pace.  When the Fed finally decides to slow down the economy, it will engineer a much more rapid tightening.

But, that’s not yet.  The model does not see a major market deterioration occurring in the next half year. Doesn’t mean the market won’t crash tomorrow, just means that it probably won’t crash in the near future.

Historically, the Fed brings the hammer down during the final year of a presidential term.  (That’s just by coincidence, of course. :o) That would mean in about a year from now.

Enjoy the season and be nice to others!

Stocks November 2018 thru April 2019: Rebound, then just OK

The forecasting model says:
November:  +3%  (Way above average)
Next 6 Months: 4% (Average)
Probability of at least breaking even:  Above average

The predictive model really likes a sudden stock market correction!  The one month forecast is unusually favorable: a 3% gain.  Don’t get too too excited as the one month model is not nearly as accurate at the 6 month model.  None the less,  the model thinks a rebound is pretty likely for November or December.

As opposed to the enthusiastic one-month outlook, the six month stock market outlook is much more tempered — probably just a normal gain of roughly 4%.  Why?  Even though the economy is doing quite well, the upside potential just isn’t great. Stocks are highly valued by most any metric.

With the U.S. mid-term elections next week, I wouldn’t count out more immediate market volatility.  Suspense is high.  Fear and hope are high.  In a week there is a very good chance that there are going to be a lot of people whose fear has turned to hope and vice versa.  My guess is that the result that will be least disruptive will be for a split U.S. Congress.  Pretty likely in my book.

Either way, any really big money in the market has already been positioned conservatively.  A short term bebound becomes most likely.

(Click on image to enlarge.)

U.S. Stock Market Expectation October thru March 2019

The forecasting model says:
October:  +1.7%  (Above average)
Next 6 Months: 3% (slightly below average)
Probability of at least breaking even:  Above average

This month’s run of the econometric stock market forecasting model has about the same expectations as last month — slightly below average   That stands to reason as the economy remains strong, but the market is highly priced by most historic valuation measures. There is no clear force immediately moving to push stock prices either up or down.  Overall, corporate profits should continue to rise as the impacts of this year’s U.S. corporate tax cuts become more and more evident.

Results that I routinely post come from a mix of forecasting models and are based on the projections that have proven to be most accurate for the past decade or so of real-time testing.  They point to a 3% stock market gain over the coming half year.  That is a bit below the long term average for 6 month stock market returns.  One month market expectations are decidedly strong at 1.7%.  Likewise the probability that the next half year will at least break even is unusually strong.

That said, for two reasons I wouldn’t put too much store in this month’s one month prediction. First,  the variants of my model that I run are unusually divergent this time.  Both the 6-month and 1-month model flavors run from strongly positive to mildly negative.  There is always some variation among my models, but not usually this much.  Whatever the reason, the models’ variation is not enough to cause any real change in the forecast.  The second reason to downplay this month’s predictions is the coming U.S. mid-term congressional elections.  Politics are not factored into my models, but they certainly impact the stock market.  Whatever the election outcome, it is almost certain that there will be more surprise twists and turns to come, and after the first week of November about half the U.S. population will be happy and half will be quite depressed.  Depressed people tend to sell stocks.  Your guess on the outcome is as good as mine,  Let us pray.

Stock Market Projection September 2018 thru February 2019

The forecasting model says:
September:  -0.4% (below average)
Next 6 Months: 3% (slightly below average)
Probability of at least breaking even:  Above average

What am I doing? Staying fully invested.  Eventually the market will have a bad fall — but, probably not for 1 – 3 years.  There are no major forces now driving the market either up or down.

The U.S. economy remains strong and corporate profits are only now starting to reflect gains from the huge Republican tax cuts.  Most economists agree that making major federal tax cuts was bad policy when the economy was flourishing. Despite it being bad policy, stock prices will continue to be propped up by this great gift to stockholders. A day of reckoning will eventually come — but, not anytime soon.

Over September and October stock market volatility may well be high as the fears and dreams of investors get wrapped up in the mid-term congressional elections.

(Click on image to enlarge.)


Be Careful What You Wish For

The U.S. economy is doing very well. Unfortunately, it is starting to do a bit TOO well.  That has happened before, and these episodes of economic boom never end well.  This one won’t end well either.  My guess remains that the demise will occur in one to three years.

The Congressional Budget Office is well known for the ‘economic scores’ that it calculates for the impacts of proposed congressional legislation.  In calculating those scores CBO relies on an economic model of the U.S. economy that it created many years ago and has been improving ever since.  The CBO model estimates how large the U.S. Gross Domestic Product should be if the country were at full employment, giving the model the name of  ‘Real Potential Gross Domestic Product’.

The CBO model gets tweaked every now and then, but not by much.  The last adjustment I can remember was a small downgrade of future estimates to account for changes in how fast the baby boomer generation is retiring. That’s why current estimates for best case GDP growth are lower that previous decades.

The graph below was downloaded from the Federal Reserve public data site ‘FRED’.  It shows CBO’s Real Potential GDP model and actual values for U.S. Real GDP.  (‘Real’ meaning that inflation has removed from the data so that everything is shown in constant 2009 dollars.)

(Click on image to enlarge, Esc to return.)

The match between actual GDP and the CBO model are amazingly close nearly all of the time.  The big exception of course is when actual GDP plummets several percent causing the country to suffer a recession.  (The gap caused by the Great Recession was unusually large — that’s why it was the ‘Great’ recession.)  As a general rule, the stock market suffers a collapse as investors realize a recession is nigh, and the market rebounds sharply when it appears that the economy is likely to recover.

It is worthwhile to click on the graph above to look closely.  Prior of most recessions the economy tends to perform better than the Real Potential GDP.  That exceptional performance can last for as long as several years — until the Fed decides the economy has become overheated.

GDP now is better than expected by the long term model.  In part that is due to the normal turn of the business cycle.  We are at the boom part of the cycle.  This time, however, normal cyclic economic expansion has the incredible financial stimulus heaped on the economy by the  deficit spending of the Trump tax cuts.  The stimulus is twice as large as the stimulus provided by the Government at the depths of the Great Recession.  That load of cash is just starting to hit the real economy.  A major boom is underway. That is wonderful!

But, the boom, inherently, will not be sustainable.

For years the Federal Reserve Bank has been raising interest rates very very slowly, trying to move them from the historically low rates necessary to break the country out of the Great Recession.

If, or rather, when the Fed determines the economy is becoming frothy, the Fed will increase interest rates faster until the economy cools down.  That will bring the next stock market crash.  Like any tragedy unfolding, the only questions are: Exactly how? and Exactly when?

Stock Market Spoiler Alert

The forecasting model says:
July:  -0.3% (below average, typical for summer)
Next 6 Montlhs: 4% (slightly below average)
Probability of at least breaking even:  0.59 to 0.96 (Above average)

What am I doing? Staying fully invested. Expecting continued volatility through the November mid-term congressional elections.

Spoiler Alert: Eventually the stock market will crash —  before the business cycle turns sour — and most probably as a direct result of the Federal Reserve relentlessly raising interest rates to rein in a frothy economy. But, don’t hold your breath waiting for the crash.  At least, not for a year or more.

The difference between short and long term interest rates, the so-called “interest rate spread” shows in very slow motion how the Fed can, and will,  choke off the economy when it decides to.  

The nature of  commercial lending is to borrow money on a short term basis at low rates and then lend it for long term projects at higher rates.  The lender profits from the spread between the short and long term rates. (Think of a bank using your savings to make housing and car loans while paying you almost nothing in interest.)  When short term interest rates start to equal, or even exceed, long term rates, the lending market dries up. Loans stop being made and the economy stumbles.


(Click on image to enlarge.)

The Federal Reserve database chart above shows the half-century history of the spread between the 10-year Treasury bond interest rate and relatively short term 2-year interest rate.  Over and over again, roughly a year after the short term rate equals of exceeds the long term rate the economy goes into recession.  Routinely, the stock market crashes before the recession actually occurs.

The key take-away here is that the interest rate spread has been falling for several years and already is getting pretty low.  It is almost time to start paying attention.  A stock market crash now is on the visible horizon.  

I remain convinced, however, that the next crash is still only on the far horizon — still one to three years away.

U.S. Stocks June thru November, 2018: Uneventful?

What the forecasting model says:
One Month Stock Market Forecast June, 2018:  -0.1% ( below average)
6 Month Stock Market Forecast May thru October, 2018: 3% (slightly below average)
Probability of at least breaking even:  0.57 to 0.94 (Surprisingly high)
What am I doing? Staying fully invested, still thinking the March – April downturn was healthy, and last month’s rebound was normal.

(Click on image to enlarge.)

The current one-month forecast is slightly negative at -0.1%. That is no big deal as the one-month forecast is not all that accurate anyway.  I only pay attention if it forecasts a one-month drop of over 1% — not usual and a definite bad sign.  Most likely the model is just showing a small bias against market performance during the May to November period.  Same story for the 6 month forecast of a 3% gain — slightly below normal.

Unlike my model, I personally expect to see extra volatility over the next half year due to the mid-term congressional elections.  Come the first week of November I think it is highly likely that about half of U.S. voters will be upset with the outcome.  Before that there is a very good chance that even more than half of the U.S. population plus foreign investors will be anxious.

To me, that is a scenario of market volatility.

But, my soul-less, nonpartisan mathematical model is right about the next market moves much more often than my personal expectations.  That’s why I built the model, after all.

Stock Market Prediction May through October,2018: More Chop Than Trend

What the forecasting model says:
One Month Stock Market Forecast May, 2018:  NO GAIN ( below average)
6 Month Stock Market Forecast May thru October, 2018: 2% (below average)
Probability of at least breaking even:  0.43 to 0.91(I’m a bit concerned.)
What am I doing? Staying fully invested, still thinking the March – April downturn was healthy.

(Click on image to enlarge.)


The Dog That Stopped Barking
So, what’s up?  The economy is doing just fine. Unemployment is historically low.  No recession is in sight. The big Republican corporate tax cuts are kicking in and are guaranteed to lead to corporate stock buy-backs.  (The buy-backs have already been announced in advance. Increased profits are going to be used to buy up stock prices, not for capital investment.)

So, why isn’t the stock market zooming up?  The stock market is down for another month. And, my models are predicting a basically flat stock market for the next half year.

My Models Think the Dog Barked in Anticipation and Shut Up When The News Hit
The graph below is a plot of how my 6-month stock market forecasts (red line) have compared since 2007 with actual 6-month stock market increases (black line). The other lines are some of the alternative 6-month forecasts I use in creating my composite forecast.  

(Wonkish: I use VALUA, the Value Line Arithmetic Index as my actual market gauge.  It performs much like the S&P 500 but tends to be a bit less volatile.)

Note that the black line (actual 6-month market performance) ends before the other lines. What that means is that the most recent actual 6-month performance is from last November thru April.  The red and other lines are predictions for the future.

The gist of the graph is that for most of the past year the stock market has performed significantly better than my forecasts.  Investors clearly had a lot of giddy enthusiasm.

There now is a developing realization that the Federal Reserve Board has no intention to allow the economy to seriously overheat.  The Fed will trump Trump’s tax cuts.

Look at the graph once more —  as a broad generalization over the past decade, the most typical situation is that after the stock market has exceeded expectations, it will typically perform below expectations.

So, although the models see a flat market coming up, I personally expect flat to somewhat negative market performance for the next half year.  What happens near the mid-term congressional elections in November is a really big unknown.

Why don’t I quit the market now? Many scenarios I have run through my models suggest that the best results occur by trading infrequently — waiting for a really rotten forecast before escape. My hunch remains that the time for exit will be a year or two from now…


(Click on image to enlarge.)