Category Archives: Uncategorized

May thru October 2024: OK, the market dropped a little faster than the forecasts predicted.

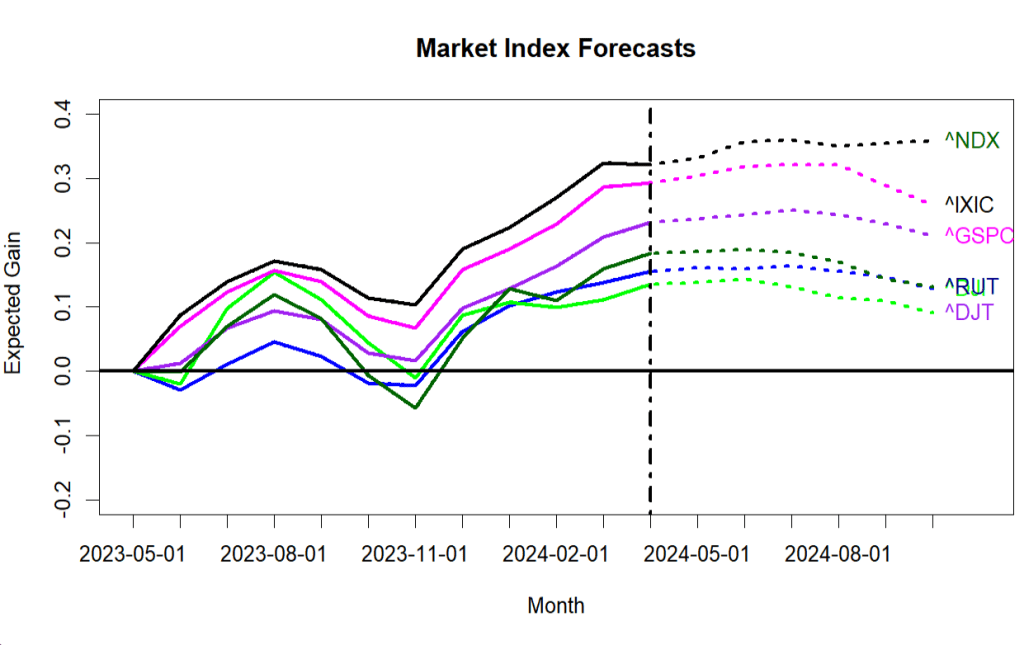
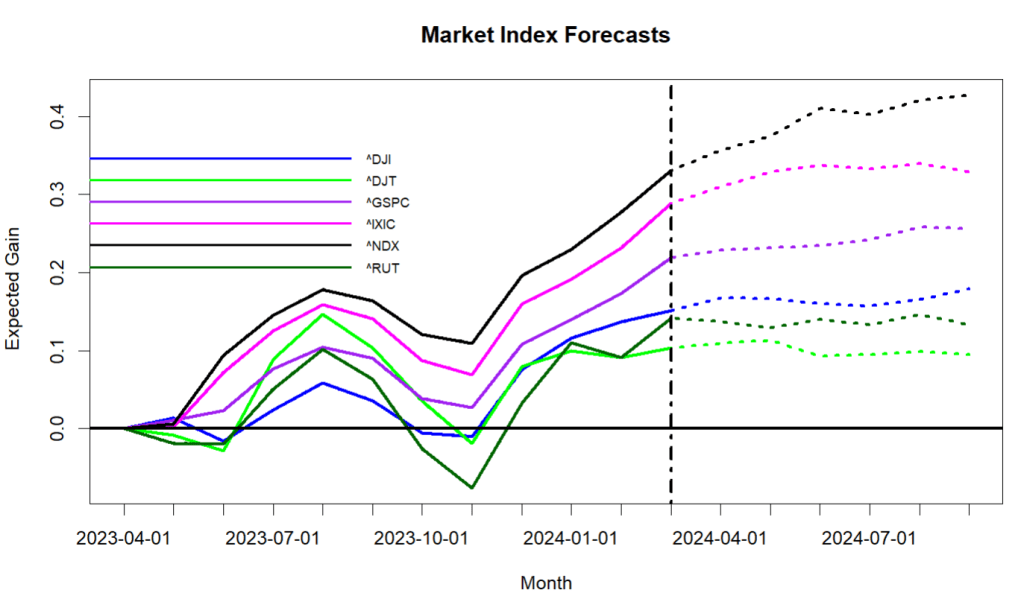
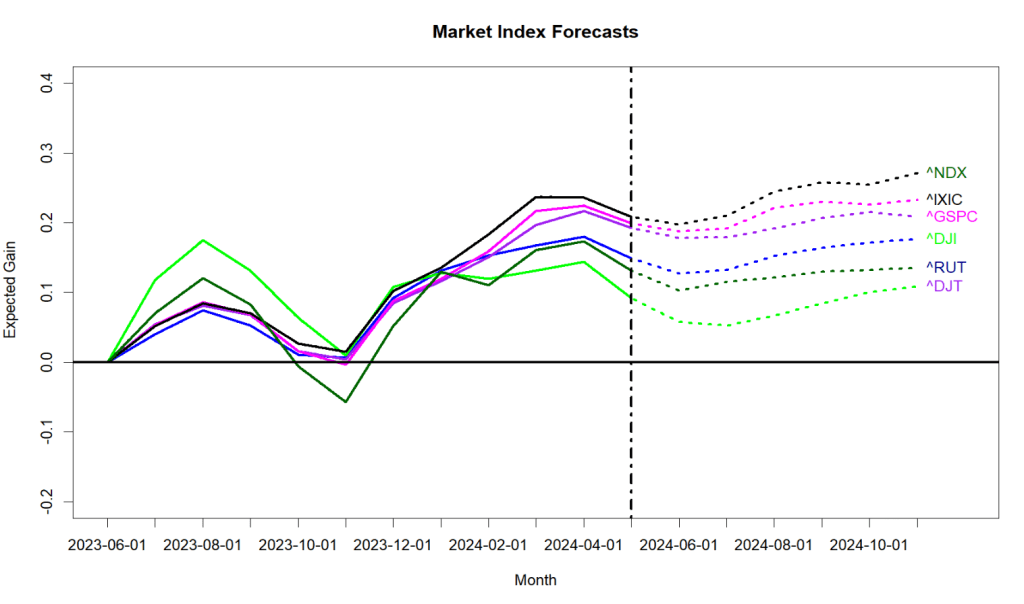
Last month these forecasts expected “the primary market indexes to pause and then retrace a bit”. Well, they did, but I grant that they went down more than a tiny bit. Anyway, the current forecasts expect the downward trend to continue for the next month or two. Nothing really major, but highly likely the market will drop some more. (Why? The equations say to blame the 1/2% increase in the 10-year Treasury rate.)

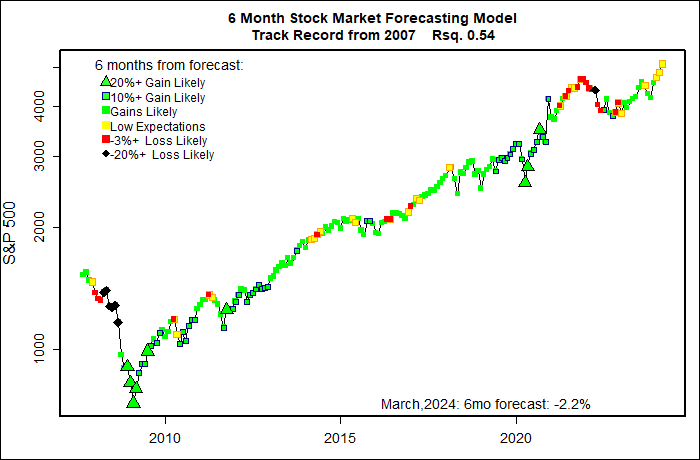
Last month the forecast for the S&P 500 was less than 1/2 of one percent positive. (Sub-Meh) But, it was POSITIVE, and for the last several months the market has been behaving above expectations. Now the tide has shifted and all the major indexes have projected 1-month losses of -1% to -3%. Does not look horribly bad, but the immediate expectation is now negative, and for the broader market the 6 month forecast is negative. The old adage “Sell in May…” looks like a winner this year.

I have a new graph to unveil. Of the 600+ large-cap stocks I follow, I keep score of the number that have strong positive 1-month forecasts versus the number with strong negative 1-month forecasts. This next graph shows the “bouncing-ball” output. The blue line is the net positive/negative score and the red line plots what actually happened to the S&P 500 for these months. (Ignore the last red month, it hasn’t happened yet.) Anyway, the net forecast is for a negative period that plays out something like last October-November.

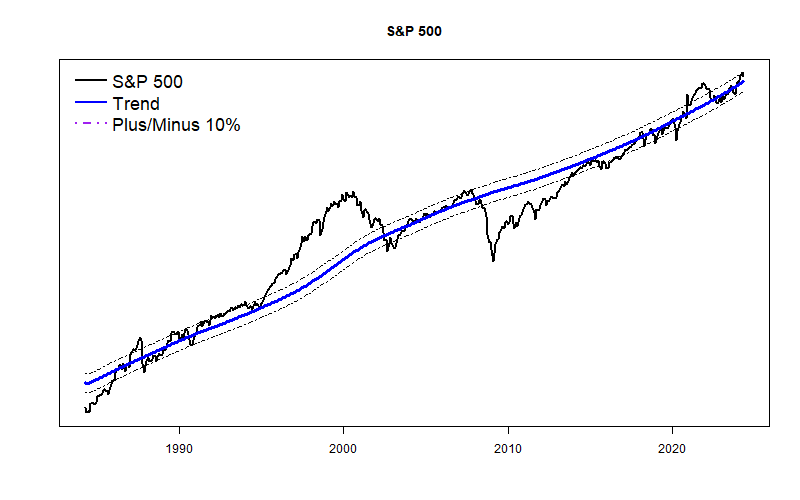
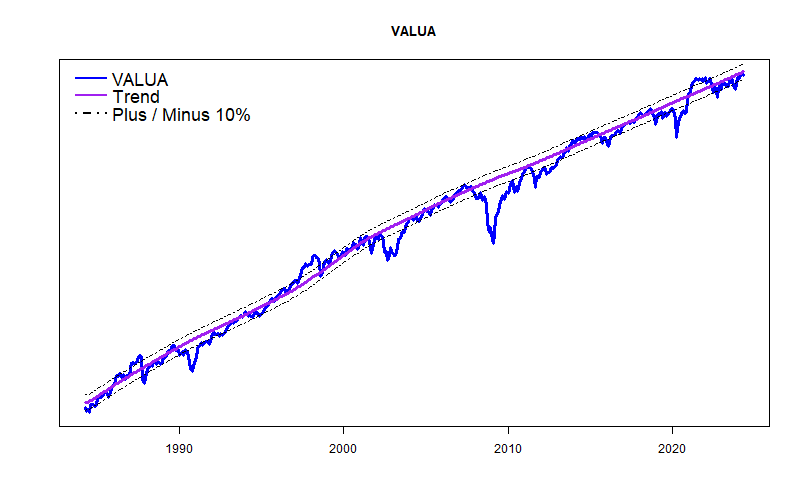
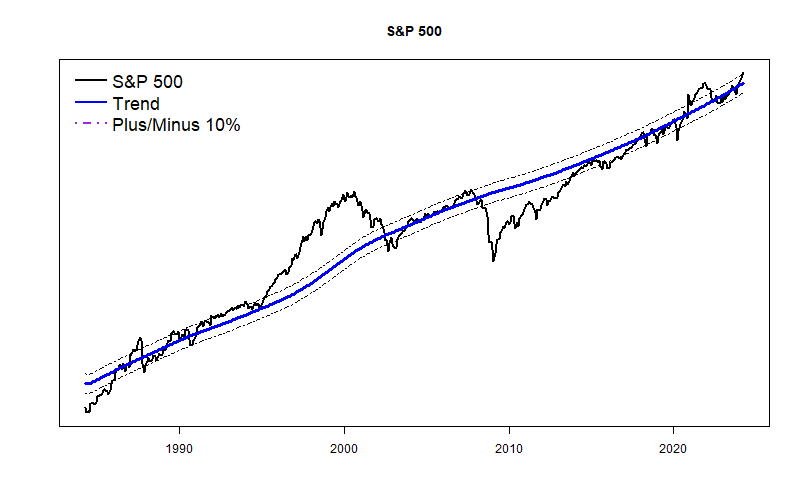
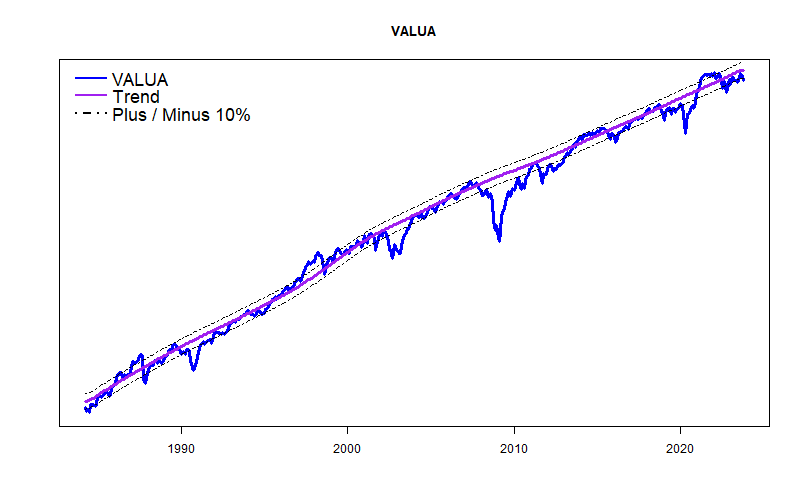
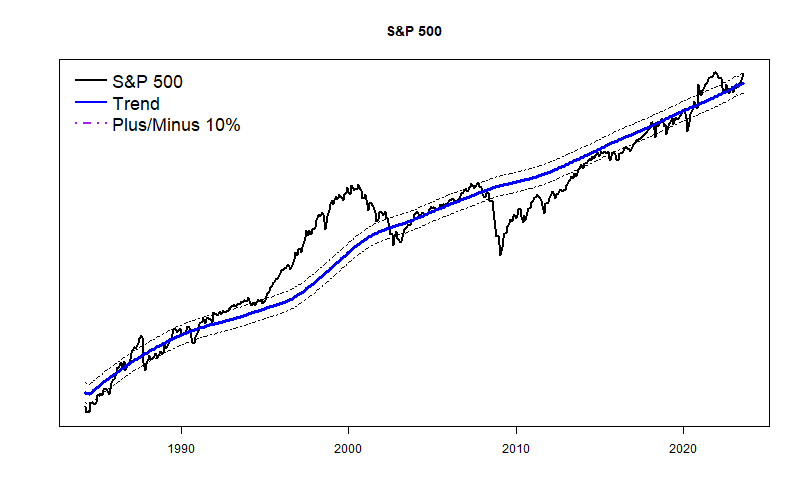
Otherwise, nothing is seriously wrong with the stock market. The S&P 500 is bouncing along its normal boundary, busily deciding if it wants to begin a new and wonderful “AI Bubble”. (My hunch is that it will.) The more staid VALUE LINE Arithmetic Average is right at its long term trend line.

April thru September 2024: Market Slowly Easing Off

The U.S. stock market has performed spectacularly well since October, so not surprisingly, my short term market forecasts expect the primary market indexes to pause and then retrace a bit. The NASDAQ 100 is projected to have a gain of about 1% this month, while the other indexes are expected to gain a mere 1/2 percent or less.

Changes in the economy are the prime drivers of these models, and not much change is expected soon. Unemployment is low and job creation is high. Corporate profits remain strong. Inflation is relatively tame and not rising. Interest rates are elevated, but compared to everything over the past half century, they are not all that bad. Gross Domestic Product numbers are right at the level of the “full employment” Real Potential GDP model of the Congressional Budget office — that is wonderful, but it does not leave much room for near-term improvement. While the threat of recession had been quite high just a few months ago, none of the data sources I tap now see much chance of recession in the next few months. And, quite thankfully the Republicans in Congress seem less eager to crash the Federal Government budget. At least for now.

The charts above show the S&P 500 currently a bit high compared to its long-term trend line, and the equal-weight Value Line Arithmetic Average is almost exactly at trend.

March thru August 2024: Split market?

The stock market has been on a tear since late October with the high-tech stocks of “The Magnificent Seven” taking the lead. The forecasts here see the technology stocks of the NASDAQ (^IXIC) and NASDAQ 100 (^NDX) sailing on for a few more months. However, more diverse stocks in the market like the Russell 2000 (^RUT) and the ValueLine Arithmetic Index are likely to peak, then falter after a few months. The overall prospect is that 6 months from now the probability of gain for the overall market is only about 55%. (Normally the market rises about 75% of the time over 6-month periods.) The S&P 500 is expected to fall a slight 2% in the summer months.

But, that is the future. March 2024 remains promising.

The long-term trend line of the S&P 500 shows it to be about 10% above trend. Too early to say if it bubbles up more or retreats.

VALUA is almost exactly at trend.

Overall, it looks like it is nearly time to start paying attention to the long term path of the stock market.

February thru July 2024: Soft Landing Continues

As the spaghetti chart below shows, my forecasts for most market indexes remain mildly positive. Technology stocks such as the NASDAQ 100 (^NDX) should stay in the lead while smaller stocks of the broader Russell 2000 (^RUT) are expected to bring up the rear. Looking out 6 months, the prospects are not as bright — probabilities of gain are looking weakish and the 6-month forecast for the Value Line Arithmetic Average is expected to drop by about a percent.

This calm forecast is striking evidence of the economy coming in for a soft landing following the Federal Reserve’s strong anti-inflation campaign. This is normally the point in the economic cycle when the stock market crashes. The high unemployment and corporate profit destruction that usually follows major interest rate increases simply have not happened — a so-called “Immaculate Disinflation”.

The growing split between the high-flying technology stocks and the main economy also shows up in my long-term trend plots of the S&P 500 and the Value Line Arithmetic Average. The S&P now appears to be distinctly higher than normal while VALUA is showing weakness. Neither of these trend divergences, however, seems to be concerning. Yet.

Hopefully, the Alpha Test of ETF forecasts concludes this month, and next month it can transition to a somewhat more credible Beta Test. The 6 month ETF forecasts are proving to be mathematically fairly accurate. The 1 and 2-month forecasts are not showing high accuracy, but they certainly are much better than any of the fruit of “Technical Analysis”.

January thru June 2024: Pause then grow more

The overall forecast for the U.S. stock market for the first half of 2024 is positive, especially for high-flying tech stocks. The overall forecast shows technology stocks continuing to outpace the broader market. But, there are some caveats. Smaller corporations in the Russell 2000 look weak for the next 3 months and the Dow Jones Industrials also appear to be mildly weak.

January, however, will probably lead to temporary setbacks for tech stocks. Even though the 1-month forecasts for the NASDAQ and the NASDAQ 100 are both positive, the 1-month forecasts for leveraged inverse ETFs for these indexes are very strong. The models for these inverse ETFs indicate that the runups over November and December were just too strong, and a short-term pull-back is likely.

A real-world factor could also hurt January gains: temporary funding for the U.S. government will run out in two stages in January and early February. A path to compromise is not clear. Concern will likely grow during the month and a market disruption could easily occur.

Looking beyond January, the stock market and economy appear hardy: inflation is down, employment is high, corporate profits are strong, and the market is near its long-term trend line. Politics is the wild card, and a big chunk of one party seems intent on throwing a wrench in the works. I doubt the market will appreciate a government shutdown, and I doubt that the prospect of electing an insurrectionist dictator will calm the investment world.

December 2023 thru May 2024: Party for Some, Many Start to Feel Hungover

November was a fantastic month for most of the stock market, a wonderful pre-Christmas party, recovering the same 9% that it had lost in the months from August through late October. The party might well continue for some high flyers, but most stocks will probably stay in place for the rest of the year.

The spaghetti plot shows that the NASDAQ and NASDAQ 100 are expected to keep on climbing for the next few months with their party likely ending around March 2024. The S&P 500 is likely to pause over December and grow modestly during the early months of 2024. Non-tech parts of the economy, typified by the Dow-Jones Industrials and the Russell 2000 seem headed for a few weak months.

Looking at the long-term trend charts, it is clear that much of the ‘ordinary’ economy in the Value Line Arithmetic Index has been below trend for months, but the S&P 500 is almost exactly on trend. Of all my forecasts, Bank stocks as a whole appear headed for a few rough months — not surprising as long as short-term interest rates are higher than long-term interest rates.

The Alpha Test of forecasting a wide range of stocks and ETFs has been surprisingly successful so far. I hope that in January I will be able to upgrade it to a Beta Test — still experimental but a bit more deserving of attention.

Happy Holidays to all!

November thru April 2024: Finally, the market may be turning up

ETFs Alpha Test posted HERE

For months, these stock market forecasting models have posted mildly negative short-term forecasts — and sadly, they have been correct. With most flavors of market indexes down roughly 10%, the models appear ready to turn up — perhaps, 1% in November, but then up roughly 8%-9% over the next 6 months. (Of course, not all the market models agree, but, looking at the spaghetti plot above, it does look like things are finally turning up. ) All in all, the next 6 months expect stock market performance to be distinctly above average. Probability of at least breaking even is about 98%.

Unless the Republicans in the House of Representatives shut down the U.S. Government or a broader war spreads in the Mideast.

As far as my forecasting models are concerned, the most pressing economic problem is that long-term interest rates have shot up. Most other economic variables have remained strong. As the Federal Reserve jacked up short-term interest rates, the 10-year borrowing rate stayed quite low. The bondholders seem to have given up now, and long-term interest rates have risen. Interest rates are likely to stay higher longer. Statistically, that is a negative factor for corporate profits and then for stock market prices. Overall, higher interest rates point to lower market PE ratios and a lower stock market. But, for now, my models expect things to get better. Happy Thanksgiving.!

As has been the case for months, the overall stock market situation is that the Federal Reserve is tightening the purse strings, but Federal Government spending remains in heavy stimulus mode. The result is like driving a car while pressing both the brake pedal and the accelerator. It works. The car keeps moving. But, it is hell on the equipment. I don’t expect things to change much until the next presidential election. By then the traitor Donald Mussolini may be in power and things might be very bad.

October thru March 2024: Better after a month or so

Value Line Arithmetic Average VALUA  +4% (Normal)
Dow Jones Industrial Average ^DJI +0.04
S&P 500 Index ^GSPC +0.05
NASDAQ Composite ^IXIC +0.04
NASDAQ 100 NDX +4%
Russell 2000 ^RUT 0.01
Next 3 Months:  VALUA looks fine, other indexes weak for the next couple of months
VALUA Probability of at least breaking even in 6 months: 95% (86% to 98% — better than average)

ETFs Alpha Test posted HERE

September was a weak month for the stock market; about what these forecasts had forecasted. The predictive models are divided at the moment, but overall they expect some continued weakness during October. The market then should become generally positive, a bit better than average.

The stock market usually stages its big moves when it has strayed far from its long-term trend. Frothy prices bring a downdraft and a panic crash quickly turns into a recovery. As shown in the graph below, both the ValueLine Arithmetic Average and the S&P 500 are very near their long-term trend lines. Unless something drastic happens in the world, a major stock market move is unlikely. Looks to me like the Federal Reserve has indeed achieved a soft landing.

September thru February 2024: A bit weak. Don’t gripe; it could be a lot worse.

Value Line Arithmetic Average VALUA  -2% (Weak)
Dow Jones Industrial Average ^DJI +2% (-0.04 to +0.07)
S&P 500 Index ^GSPC +3% (-0.04 to +0.09)
NASDAQ Composite ^IXIC +0% (-.0.07 to +0.08)
NASDAQ 100 NDX +3% (-0.06 to 0.11)
Russell 2000 ^RUT -2% (-0.17 to +0.12)
Next 3 Months:  VALUA still looks mildly negative.
VALUA Probability of at least breaking even: 50% (46% to 57% – Well below average

ETFs Alpha Test posted HERE

Agonizingly slowly, the Federal Reserve’s relentless campaign of using higher interest rates to slow inflation continues, while high deficit spending by the Federal Government works in the opposite direction to stimulate the economy. The net result remains a very gradual slowing of the economy. The economy appears to be on the final approach for what hopefully will be a soft landing, happening without a stock market crash.

My forecasting models tell that same story. Prospects for the broad U.S. stock market stay slightly below normal, a tad worse than last month. My primary bellwether is the Value Line Arithmetic Average VALUA: equal weighting of about 1700 companies representing about 90% of U.S. corporate activity. Since 1984 VALUA has gone up for 88% of all 6-month periods. In the next six months, the models only give it about a 50% chance of breaking even, and overall the models predict a 2 percent loss. (Range: +5% to -8%) The worst forecasts are for 3 to 4 months out and could be in the vicinity of -10%.

Sadly there lurks a chance of a major financial panic and collapse in the big-money long-term debt arena. Financial collapses during the Savings and Loan Crisis of 1985-1987 and the Great Recession of 2007-2009 were both instances of Federal Reserve interest rate increases that led to short-term interest rates being higher than long-term rates — an “inverted yield curve”. Today’s interest rate inversion is greater than previous inversions and has already lasted much longer than any other. Plenty can go wrong and it will play out over the next year.

As shown in the graph below, my VALUA models have done well over the past decade in forecasting major turns in VALUA. Right now, they do NOT expect a major surge in prices and they DO NOT YET see a major price collapse. All the other major market indexes that these models assess have similar expectations: up or down a couple percent.

I have posted the second monthly update to my alpha test of Exchange Traded Fund forecasts. Hopefully, next month I can add 1 month to 5 month forecasts for the same group of ETFs.

August thru January 2024: Some Wavering

Value Line Arithmetic Average VALUA  +0.7% (BELOW average)
Dow Jones Industrial Average ^DJI +7% (-0.01 to +0.14)
S&P 500 Index ^GSPC +6% (+0.01 to +0.13)
NASDAQ Composite ^IXIC +10% (0 to +0.10)
NASDAQ 100 NDX +5% (-0.04 to 0.14)
Russell 2000 ^RUT +6% (-0.09 to +0.21)
Next 3 Months:  Rest of summer for VALUA still looks mildly negative.
VALUA Probability of at least breaking even: 50% (46% to 57% – Weakening )

ETFs Alpha Test posted HERE

The most tested of my forecasting models, for the Value Line Arithmetic Average (VALUA) are much less positive than just a month ago. The models expect the broad VALUA market gauge to stay flat or drop a bit through the end of the year. My more recent models for a large number of stocks still are more positive, especially for tech stocks. I trust the older models more than the new ones. Going forward, less optimism seems prudent.

The problem going forward is that the market has been so strong this summer — resulting in less probable gain going forward. The long-term S&P 500 graph makes it appear that prices are getting a bit frothy. Could be we are seeing a new market bubble develop.

As noted above, I finally have started posting 6-month forecasts for a large number of Exchange Traded Funds. I am cautiously optimistic, but I want to emphasize that these forecasts have not been tested in real-time. They may be dead wrong. Please email me any comments or questions you may have at TomTiedeman@gmail.com. With time we will see if any of these pan out.