2015 should be a thoroughly average year for stocks. My macroeconomic models predict modest stock market growth through 2015, and see no reason the path during the year to be any smoother or more volatile than normal. Negative market surprises, if they hit, will most probably be during the second half of the year. A boring year would be wonderful!
The stock market, of course, will do what it ‘wants’, regardless of these predictions. That said, the model has performed well since 2007, so its forecasts may be worth paying attention to.
The tremendous multi-year stock market recovery from the depths of “The Great Recession” is almost complete. More years of strong double-digit gains grow less and less probable. On the other side of the coin, serious action by the Federal Reserve to damp down the economy is still about two years away. Until then, a routine bumpy upward path for the U.S. stock market is the most probable future.
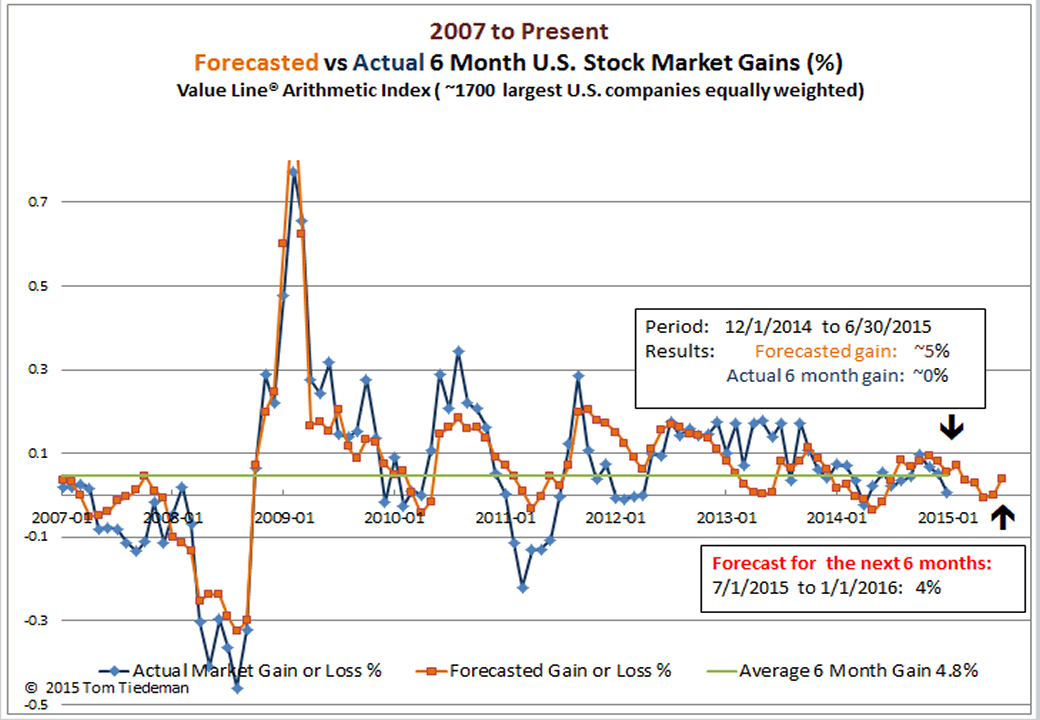
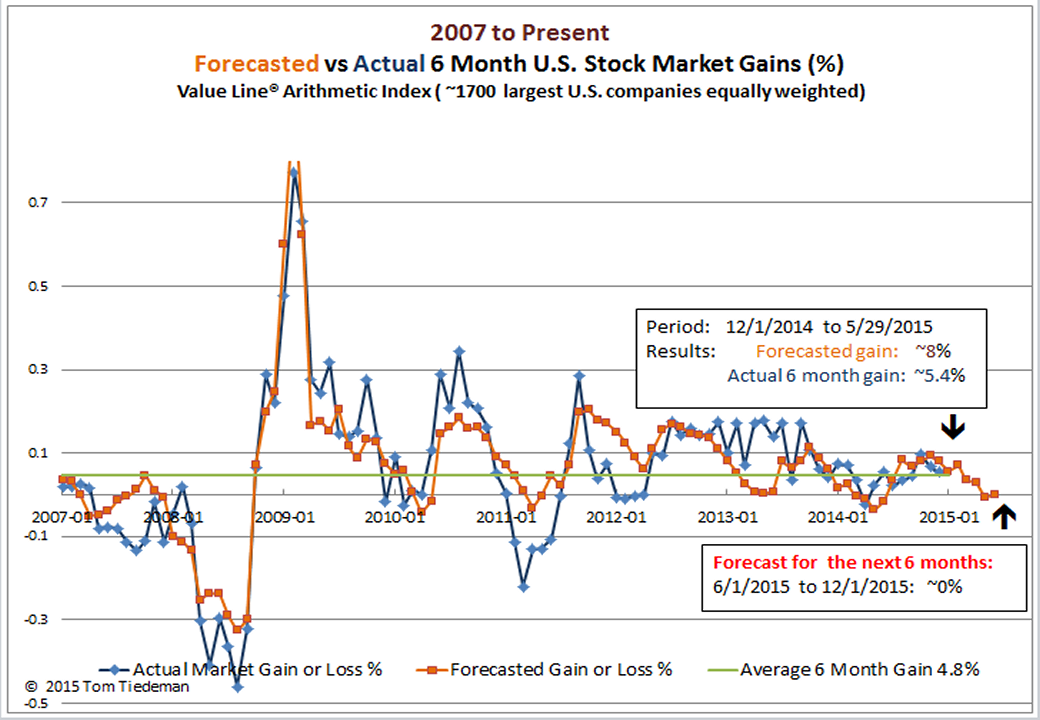
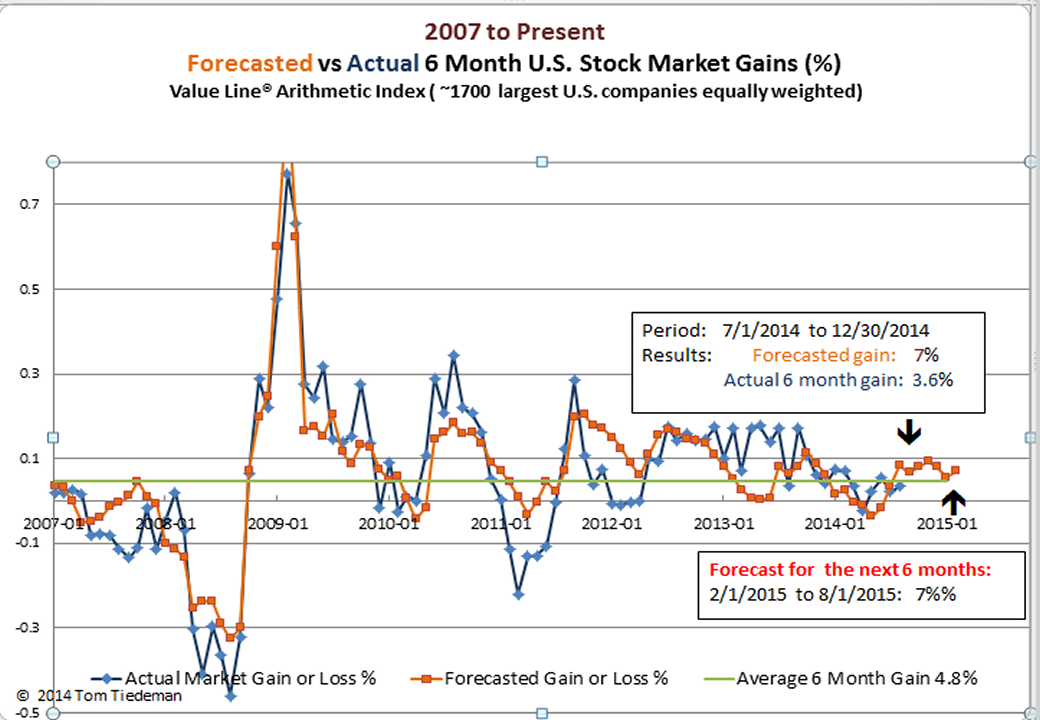
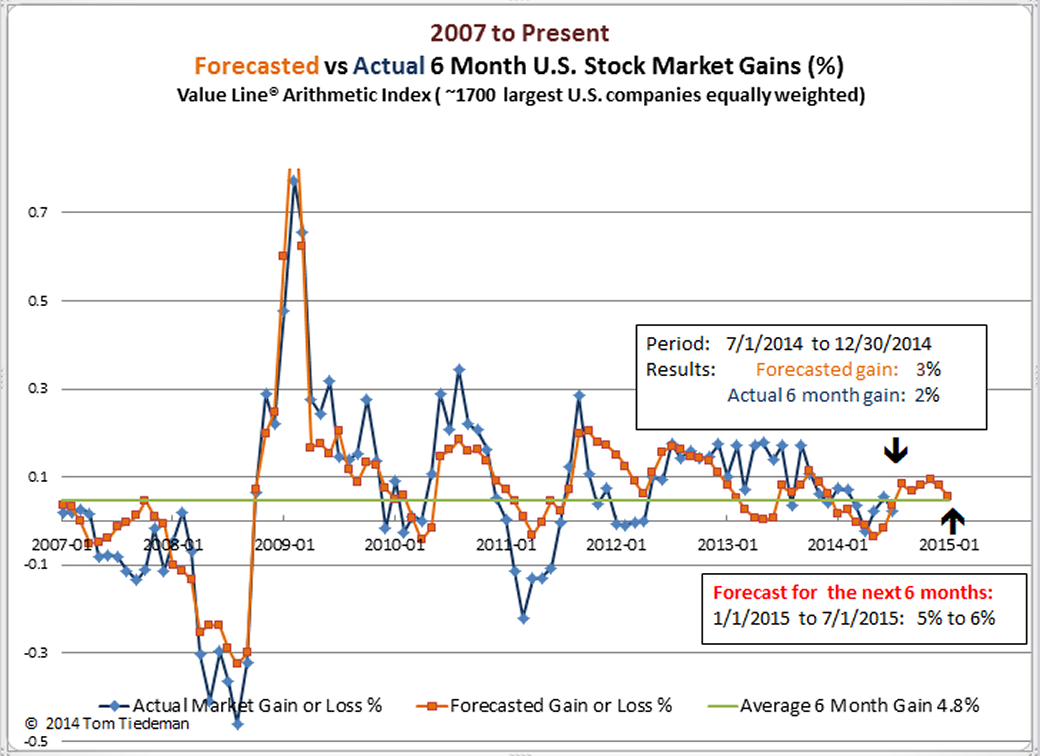
U.S. Market Forecast (based on the Value Line Arithmetic Index):
Probable stock market gain 1/1/2015 to 7/1/2015: 5% to 6% (Avg. 6 months gain since 1984: 4.8%)
Probability of at least breaking even : 75% (Average for all months since 1984: 73%)
(Click on image to enlarge.)
What drives this typical stock market prediction?
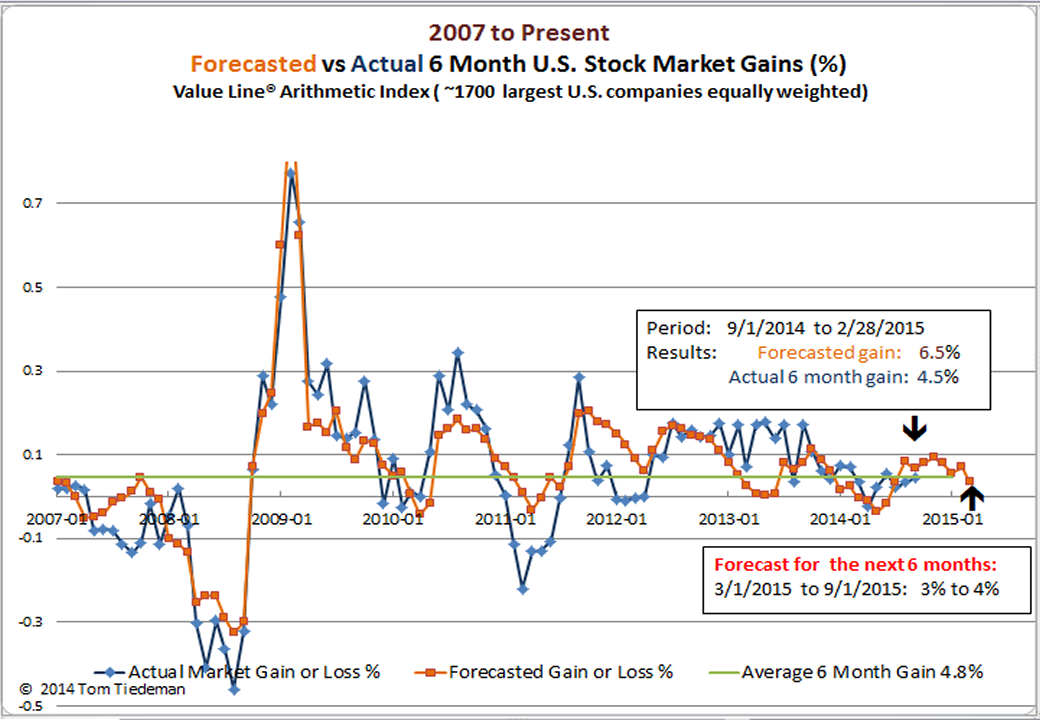
Regression to the Mean: The Value Line Arithmetic Index that my models follow includes over 90% of U.S. corporate activity, but because of the way companies are weighted, it is much less influenced by speculation than more popular indexes like the Standard & Poor’s 500. As a result, it follows a much steadier growth pattern than other indexes. The Value Line Arithmetic Index is now near its long term trend making growth at normal rates very probable. The next 3-5 years should also yield typical market growth.
Continuing Moderate Economic Growth: The 3rd quarter of 2014 produced surprisingly strong economic growth. That may well be an exception caused, perhaps in part, by dramatically falling oil prices. The longer term growth trend has been fairly slow and GDP remains below potential. There is room for economic growth.
Small Chance of Recession: The stock market responds poorly to economic disruption. The metrics I track show few impending tornados on the economic horizon. Eventually, of course, the Federal Reserve will bring on the next recession by sharply raising interest rates. However, a large increase in rates is probably 2 – 4 years away. Interest rates are still at historical lows and the Fed is only expected to make its first interest rate increase in mid-2015. My expectation is that when the rate increases begin they will move very slowly. So much long term money has been borrowed at current very low rates, a sudden increase would destabilize the economy much more than the traumatic shocks of of 2006-2008. I wouldn’t be surprised if mid-year the Governors of the Fed intentionally try to deflate markets a tad with some hawkish comments. Certainly they would rather do that than to cause actual serious disruption to the ‘real’ economy.
Plenty of Gray Swans Floating Around: A true black swan can always appear on the world scene. But, that is a rare event (by definition). Instead, there are plenty of major potential economic positive and negative possibilities. The ones that I see developing do not appear likely to bring major disruption in the near future. There are countless observers following each of today’s gray swans. As a result, major sudden surprises become less likely.
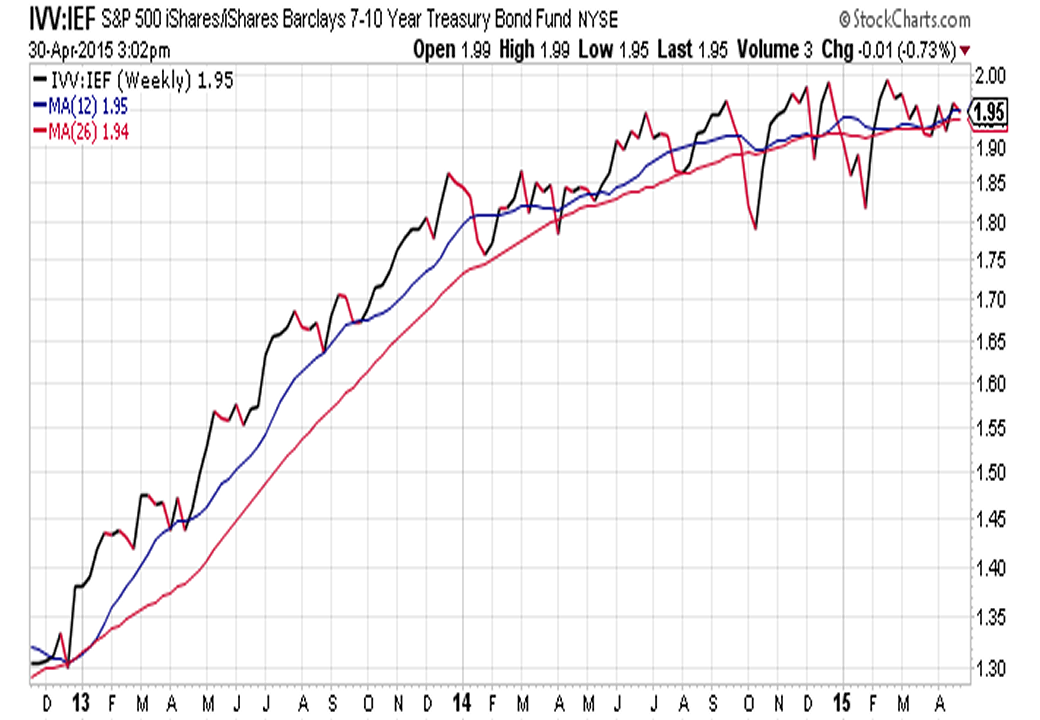
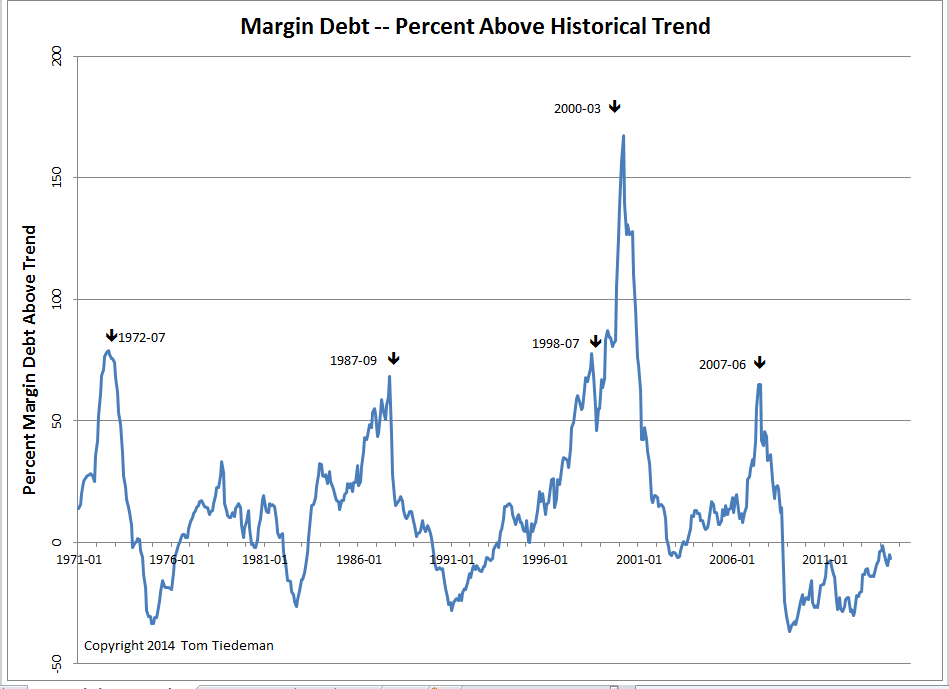
Speculation Has Not Exploded Yet: Historically, margin debt has proven to be a reliable indicator of stock market speculation. So far, it is nowhere near the level that typically flags collapse of a speculative bubble.
(Click on image to enlarge.)
Best wishes for a happy and prosperous New Year!