Author Archives: tomtiedemangmailcom

What usually happens next?

The coronavirus pandemic is not ‘business as usual’ for humanity or the economy. I have no idea if these forecasts have any validity. 

Forecast April thru September 2020: +38% 
Probably of at least breaking even: 99%+

I have no special knowledge that says whether the current stock market crash and economic recession is actually different from human and economic disasters of the past.  The basic premise of the computer models I track here is that the market will do in the future roughly what it has done in the past — concentrating on a handful of key business and economic variables tracked since 1984.  But, at this point no one really knows what will happen next. Maybe the economy will commence a somewhat typical recovery, or maybe not.

What I think the forecasting models are saying is that six months is a very long time from now. A lot of surprises can and will happen. There is a tremendously powerful driving force for the economy to ‘revert to the mean’, to regain its long term path.  Already governments around the world have shown that they will do ‘all that is necessary’ to support the economy and return things back to normal.  People are clambering to get back to work and restart their normal lives. Eventually things will get better.

I did not believe how positive the models’ current predictions were when I first ran the calculations this month.  News of the pandemic is horribly grim.  We have really just started the economic quarantine process.  Most of the economic harm from shutting down much of the economy has yet to occur.  Things WILL get worse.

I doubted the data that drive the models.  Most of the economic variables that form the basis of the models are still highly positive and don’t reflect the sudden economic damage that is happening right now.  For example, the data I use still see a very low probability of a near term economic recession — that is obviously wrong. Similarly, leading economic indicators are still basically quite positive — wrong.

So, I ran the calculations again, but substituted drastically worse numbers for several economic variables.  This time the forecasts from the models were even more positive! Not what I was expecting. What the models seemed to say is that in ‘usual’ stock market crashes, by the time economic data can reflect just how much devastation has occurred, the stock market is already looking ahead to the coming recovery.

Good luck to all is getting through the near future. Stay safe.


(Click on image to enlarge.)


Long Term Trends

(Click on image to enlarge.)


(Click on image to enlarge.)


Time to meet TED

TED will tell you day by day if the world economic system is in severe crisis. TED is really worried today.

A week ago, TED said the world economy was scared, but not yet in full panic mode. TED, the world bankers’ fear gauge, was at 0.15% in mid-February and 0.57% last week. Then everything hit the fan.  It now appears to be about 0.90%, a major warning signal.

The TED rate, or TED spread, is the difference between the interest rate of a 30-day U.S. Treasury Bill and the 3-month LIBOR, the rate charged to borrow U.S. dollars overseas among major banks.  Here is a link for the current 1-month LIBOR.  (The data on the FRED charts that I link below are one week out of date. Right now, that one-week time lag matters.)

In normal economic times the 3-month U.S. Treasury is just about the world’s safest and most liquid asset, and therefore the lowest interest rate in the financial world.  LIBOR (London Interbank Offered Rate) is generally the next best thing, a slight premium usually about 1/4 percent above the 3-month Treasury Bill. The TED rate is simply the difference between these two major short term interest rates. When TED is high, it means that major world bankers don’t trust each other, even for short term loans.

The world’s major bankers, like stock market speculators, are a nervous lot.  Things fluctuate daily  A 5-year view of the TED spread (below) shows lots of volatility, even in good times. Most recently TED shows a sharp spike.  Undeniably, bankers are getting scared about worldwide recession and possibly financial market breakdowns. The TED premium, even a week ago, was three times as high as it was in mid-February. Now it is 6 times the February level. (link)

(Click on image to enlarge.)

But, it’s all relative.  In a 30-year view, the current TED spread is worrisome but not catastrophic. (link Gray areas show recessions.)  The message is clear: the world’s central bankers have good reason to be pulling out all the stops to try to keep the world financial system from collapsing.  There is a lot of doubt that all major players in the game are going to survive intact.

(Click on image to enlarge.)

Lest anyone actually feel cheerful, looking at the long term plot of LIBOR  shows that the world interest rates have been falling for about a year, behaving like a major recession was on its way. (link)  And that was long before the novel coronavirus hit the world. Ulp.

(Click on image to enlarge.)

Coronavirus Update: I'm out for now.

Please ignore my forecasts for at least the next several months.  Feel free to also ignore my personal opinions below. They are not intended as stock market advice. I certainly do not know what is going to happen.

Apparently many people believe that fears of the novel coronavirus are grossly inflated. I sure hope they are right, but I don’t think they are.

The human and economic changes brought on by the coronavirus pandemic have only just started to hit worldwide.  About 3 months ago the virus did not even exist!  So far  less than 0.0001% of the world population has been infected.  Before this is over some epidemiologists fear that roughly half of the world population may have contacted the disease. This is nearly impossible to comprehend.  There are more unknowns about the pandemic than things we know.

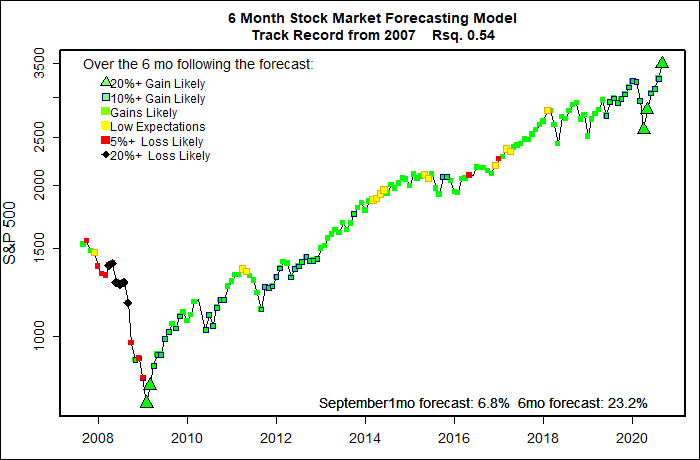
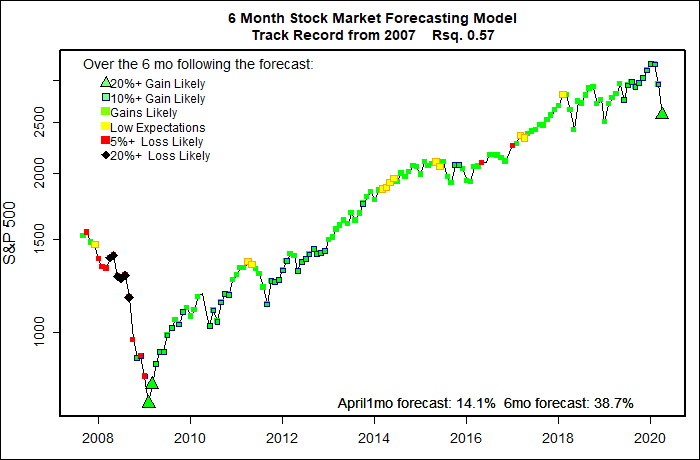
The epidemic came upon us suddenly — a huge and horrible Black Swan.  Most of the data sources that form my models do not reflect the catastrophic changes that I believe will be slamming the world.  I will continue to post the monthly forecasts from my models since producing a public real time record of these forecasts has been the purpose of this blog from the start. I might as well be honest about just how wrong these forecasts turn out to be. Eventually, I trust the data I use will start to reflect our new realities.

It was probably a mistake, but a while ago I started posting about what I am doing with my own money.  My intent has not been to advise others, but just to be honest in indicating how strongly I believe in the econometric models. Now I am just logging the fact that I do not believe the rosy forecasts that are currently coming from the models.

Two weeks ago I wrote that I had closed my positively leveraged positions and went to approximately 70% invested.  I am now almost entirely out of the stock market and have some short positions.

My personal stock market opinions are often quite wrong — that’s why I created my objective models. But, for what they are worth,  here are my thoughts.

In my personal opinion this market downturn is far from over. 

There is a hope that the virus contagion will all blow over as the northern hemisphere warms up in summer.  As of today, many closings of schools, places of assembly, and other activities are being announced as temporary closures of two weeks or so. Many people believe that fears of pandemic are totally overblown.  It would be a wonderful miracle if the virus onslaught suddenly disappeared.  I personally doubt that will be the case.

The current world strategy has come to be called “social distancing”, or “flattening the curve” — curtailing countless human activities in order to slow the spread of the disease with a simple objective: keep the number of infections below the point where hospitals are unable to treat the vast flow of critically ill patients.  Many people may still die, but at least deaths will not surge because there is not enough room in hospitals. Clearly the hope is also to buy time needed to find better means of treatment and eventually to find a vaccine.

The social distancing strategy, however, has a very high and still largely unknown economic cost.

In very crude and inaccurate math, each week of lost employment leads to a drop of gross domestic product in the order of 2%. For a person to not work for a week they lose about 2 percent of their yearly output (1 week of about 50 yearly work weeks.) Someone pays for that lost output, either the employee, their employer, the customer, or the firm’s investors.  So, for the national economy a week of lost work for everyone is roughly a 2% drop in gross domestic product.  A couple of weeks of lost national work output probably would put us into recession.  I cannot even fathom what several months of lost output could mean.

The Great Recession of 2008 produced a GDP loss of 5.1%.  The S&P 500 dropped about 50% as a result. Hopefully I am quite wrong, but in my fears the coming recession and bear market have the potential to be much worse. After Friday’s  wishful thinking historic price surge, the S&P 500 is now down about 20% from it’s February high point. Just barely still in a Bear Market.

Certainly emergency measures by government will soften the economic blow for many people — more paid time off, unemployment, eased foreclosure rules, etc.  But, there will still be countless people and businesses who will receive crushing blows that government aid will not touch.  My local friendly restaurant already survives on a small profit margin — government aid isn’t going to replace all of the lost customers for months and months.  The same story is becoming true for much of the economy. The nation is now facing major industries such as air transit, retail, restaurants, entertainment and tourism shut down indefinitely.  The direct effects are likely huge. The ripple effects will be like tsunami’s!

When businesses and individuals go broke, new government programs and forms of assistance, no doubt, will provide some with loans and other forms of assistance.  But, we are still going to be faced with a large number of bankruptcies, foreclosures and bad loans.  Financial contagion could become a reality.  Political unrest in other parts of the world would not be a surprise. We aren’t there yet, true disaster has not hit. At the moment it is like we are all just taking a few weeks off after some kind of giant snow storm. But to me, the writing is now on the wall.

I do not feel that the worst has passed for the U.S. stock market.

Stay healthy!

Stock Market Forecast March thru August, 2020: No Real Clue

IGNORE THIS MONTH’S FORECAST
The statistical stock market forecasting model says:
March, 2020  +5% 
Next 6 Months:  +17%  (Very high.)
Probability of at least breaking even: 95% – 97% (74% is long term average.)
What am I doing? Had been fully invested since spring 2009. Just closed leveraged positions. Still 70% invested, but worried. May sell more?

The novel coronavirus epidemic that has quickly spread to many countries is exactly the sort of Black Swan event that my models cannot predict.  These models are based on long term economic data, but the onset of covid-19 has been so rapid that the real economic impacts have not yet become apparent in the economic data stream. The epidemic is also totally unrelated to the normal business cycle that weighs heavily on how the models are constructed.

Please ignore my forecasts for the next few months.  I have no trust in them for now.

The current prediction coming out of the models sees a classic “buy the dip” opportunity.  The basic economic picture looks rosy (according to the data), hence last week’s selloff presents a wonderful buying opportunity — according to the model. But, I am not buying that story.

I certainly am no expert on viral epidemics, but a couple of things seem clear:

  1. We should learn during March and April whether covid-19 contagion will die down during warmer weather like normal annual influenza spread. If not, a pandemic would seem to be certain. If the epidemic does end with warm weather, my optimistic forecasts could well prove to be correct. Totally unknown.
  2. I don’t see much chance for any good news until at least the end of March when we will have the first indication of whether the contagion dies off with warm weather. That means at least one more month of raw fear in the market. Obviously that is a bad omen for the next month of market activity.
  3. With or without millions of cases developing around the world, there will be a negative economic impact. World tourism has already had a body slam.  It wouldn’t be much of a surprise if quarantines, time off from work, and supply interruptions will stall economic growth enough to put the economy into at least a technical recession.  Even with a minor economic disruption, corporate profits could take a major hit that would continue to show for months after an epidemic ended.
  4. There is so much that we do not know leaving us with no means to draw rational limits to our fears. The market might fall into a vicious cycle — market drops lead to more fears that, in turn, lead to further market declines. We just do not know.
  5. Once the world feels safe again — whenever that happens — the collective sigh of relief will likely create an incredible buying opportunity. But, we really don’t have any clarity yet on how this will all play out.
Good luck all.


Stock forecast February thru July, 2020 — Still pretty good

The statistical stock market forecasting model says:
February, 2020  +2% 
Next 6 Months:  +11%  (Good.)
Probability of at least breaking even: 95% – 97% (74% is long term average.)
What am I doing? Fully invested since spring 2009. Preparing to worry later in the year.

(Click on image to enlarge.)

All the flavors of my predictive market models remain decidedly positive.  There has been a drop in the enthusiasm of the forecasts over the past few months, but they remain strongly positive with a very low probability of net decline over the coming half year.

Of course these market expectations don’t mean that the market can’t have a horrible collapse right away.  Coronavirus or something else might blow things up. I don’t have any special insights on ‘black swans’.

The forecasts only mean that it the U.S. stock market responds to some key economic variables in pretty much the same way as it has behaved for the past several decades, then the market will probably do pretty well in the coming half year.

That said, to me (as opposed to my forecasting models), considerable stock market volatility with a negative slant seems likely until the world threat of coronavirus becomes better defined.

2020 Stock Market Forecast: Blow off top. Then?

The statistical forecasting model says:
January, 2020  +3.3% (Very good, but January is always hard to predict.)
Next 6 Months:  +11%  (Excellent, not quite as optimistic as last month.)
Probability of at least breaking even: 95% – 97% (Still great.)
What am I doing? Fully invested since spring 2009, but preparing to worry later in the year.

(Click on image to enlarge.)

 A headline at MarketWatch.com this week spouted: The U.S. economic expansion will last ‘many more years’ and 2020 will be good for stocks, says prominent economist.  That kind of grand claim always seems to come back sooner or later and bite the author on the butt. Reminds one of the eternally quoted statement by noted economist Irving Fisher that “stocks seem to have reached a permanently high plateau”. Fisher’s words came, of course, in early October, 1929, just a few weeks before the Great Crash of 1929.

For the past several months the projections by the several flavors of my predictive models have been strongly positive — more positive that I had expected. The expectations seem to have been largely on track — stock market performance through the fall and to the end of the year has been stellar. And, the current forecasts from my 6 month stock market models remain strongly positive. That’s the good news.

 The bad news is that two of my favorite predictors of an economic recession have ticked up for the first time in about a decade.  The increased risks of recession have not been enough to reduce these 6 month market forecasts. Yet.

(Click on image to enlarge.)

I don’t know if the stock market will tumble — or jump up — later in the year. The models only look ahead 6 months at a time. The current direction, and the models’ predictions are for a blow-off top over the next few months.  Come February I expect to have a much clearer picture of how the market will perform later in the year. A recession either will, or will not come into focus.  My personal hunch (and not the models’ predictions) is that the end of 2020 will be very difficult. I am not changing my investments until the models turn decidedly negative.

Long Term Trends
The S&P 500 remains nearly 12% above the long term trend for the index.  The Value Line Arithmetic Index performed well in December — it remains about 4% below the long term average, but that is better than last month.  Overall the divergence between the S&P 500 and VALUA has decreased — and that is a good thing!  Neither index is far enough from its long term trend to indicate a serious market problem.  By way of comparison with a totally different market metric,  the Market Fair Value Graph at MorningStar.com indicated the market is about 4% above fair market value — not a serious problem.

(Click on image to enlarge.)

(Click on image to enlarge.)

Happy New Year to both of my loyal readers! Hang on tight!

Exhuberance Meter?

Feel free to ignore this post. It does not include a new forecast and is horribly boring. Enjoy an eggnog instead.

We may be near a major turn in investor psychology.
The S&P 500 average is currently about 10% above its very long term trend line.  The Value Line Arithmetic Average, my favorite market index, is roughly 10% below its own long term trend line. I have started plotting the divergence of these indexes, and it appears to show long term shifts in investor optimism.  I will start posting monthly updates of this graph of index divergence. Don’t hold your breath, but things might start to get interesting over the coming year.

What Divergence?
Nearly every month I post multiyear graphs of the S&P 500 and VALUA along with each of their long term trend lines.  The trend lines are described in detail under the tab “Long Term Model” at the top of the blog. For convenience, along with the actual long term trend I include dotted lines showing 10% above and below the trend line.

The market trend lines I calculate are not like the moving average trends you will see on most stock price graphs. As a quick overview, my trend lines are based on very long economic expectations: long term business growth, Real Potential GDP, and  smoothed interest rates on 10-year Treasury Bonds. Whatever the stock market has been doing over the past few years has nothing to do with where the trend line heads.  Except for when the stock market goes crazy, the actual VALUA values have stayed remarkably close to the long term trend expectations. The S&P 500 does not stay as close to its long term trend, and therein is the source of a divergence.

(Click on image to enlarge.)

(Click on image to enlarge.)

Generally speaking, nearly all stock market indexes go up and down together — hour-by-hour, day-by-day, and month-by-month. But…

Divergence may follow a pattern.
A remarkably steady multiyear shift occurs in the relative performance of the S&P 500 and VALUA.  The graph below shows the summed divergence of the S&P 500 and VALUA from their respective trend lines.  As I wrote above, the S&P 500 is now about 10% above its long term trend while VALUA is about 10% below its long term trend; these combine to a total 20% divergence.

(Click on image to enlarge.)

Here is how I view this 35 year graph.  Although there is plenty of seemingly-random variation month-by-month, there are also surprisingly steady long term trends going on over periods as long as a decade.  The big spike in the center of the graph is the story of the Dot-Com bubble.  From the mid-1990’s to 2000 the S&P 500 performed vastly better than VALUA. It was a truly incredible bubble!   The S&P 500 was flying way, way above its long term trend line. The broad market, as represented by VALUA really did not experience the full extent of the bubble. VALUA maxed at about 10% above trend.

By way of comparison, the period 2006-2009 leading up to the crash of the Great Recession did not show the same degree of stock market speculation as the Dot-Com fiasco.  All the crazy financial action took place in the world of real estate speculation, not the stock market. None the less, during the years leading up to the 2008 crash, the S&P 500 was performing better and better than the plodding VALUA. In 2008, the divergence peaked at about 20%.  (Just  like today’s level.) And then the market crashed.

At the pit of the crash, both the S&P 500 and VALUA were far below their long term trend lines, but the S&P 500 was in much worse shape.  It took about half a decade of recovery for the S&P 500 relative performance to match that of VALUA.

Today?
The  current 20% total divergence between the two indexes may or may not be near some sort of critical level. But, it is enough of a divergence to cause me to start to fret.

Based on all of the federal government stimulus (tax cuts, trillion dollar deficit, increasing money supply, low interest rates, FED bond buying), my best guess is that a stock market melt-up will continue to develop, causing the divergence to shoot up. The S&P 500 will probably far exceed VALUA gains. A melt-up of stock market prices would be well worth enjoying.

But, if divergence shoots up, we will have good reason to worry about a stock market crash happening sooner, rather than later. Maybe we can watch that setting up

Stock Market Prediction December Thru May, 2020 – Strong

The statistical forecasting model says:
December, 2019:  +4.5% (Outstanding.)
Next 6 Months:  +16%  (Very high.)
Probability of at least breaking even: 96% – 99% (Excellent)
What am I doing? Fully invested since spring 2009.

The month-by-month string of positive forecasts coming from my computer models is getting boring, and it concerns me some.  The forecasts continue to be exceptionally positive; the market does go up; but the actual market increase is weaker than my forecasts.

The predictive models see that the federal government is injecting huge amounts of stimulus into the economy (low interest rates, corporate tax cuts, RAPIDLY increasing money supply, deregulation) but the stock market is responding less than typically would be expected given the amount of joy juice mixed into the punch bowl..

The situation is a bit complicated.  The mega-cap stocks of the S&P 500 are doing pretty well — they are performing roughly 10% better than their long term performance trend.  But, the less sexy stocks of the Value Line Arithmetic Average (the metric that my models are specifically designed to forecast) are dawdling along at roughly 10% below their long term trend line.  (Look for a mid-December post that will address this growing divergence between the S&P 500 and Value Line.)

(Click to enlarge.)

Long Term Trends
(See the “Long Term Model” tab above for a discussion of how the long term trend lines are created.)

For months the Value Line Arithmetic Average (VALUA) has been plugging along fairly steadily at about 10% below its long term trend line. That is not normally a big concern.  There appear to be plenty of instances in the past when average appears to “bounce” back up from that level. But, the few times when VALUA does not bounce — those have been major market crashes.

However, if you look at the performance of the S&P 500 compared to its long term trend line, the difference is clear:  unlike VALUA, the S&P 500 has been hugging a line at about 10% above its long term trend.

The total performance divergence between the S&P 500 and VALUA is now roughly 20%. Not an immediate cause for alarm.  But, if the divergence grows significantly, it will show that either: 1) the S&P 500 is moving into a blow-off market top, or 2) the market is heading into a major tailspin.
Don’t hold your breath, but this bears watching over the coming months.

Whatever happens, my money rests on following the predictive models. They remain highly positive.

U.S. Stocks November thru April, 2020 Still Very Positive

The statistical forecasting model says:
November, 2019:  +4.8% (Outstanding.)
Next 6 Months:  +17%  (Very high again.)
Probability of at least breaking even: 96% – 98% (Excellent)
What am I doing? Fully invested since spring 2009.

Since mid-spring all flavors of these data-driven predictive models have been amazingly optimistic toward the U.S. stock market. The market had been down in late spring and rebounded since then, so the models were not wrong headed.   But, the market increase was not near as much as the models had forecast. So — what’s up?

First, I think the models are very aware that the Federal Reserve and the U.S. Treasury have turned financial stimulus up to near-full force using lowered interest rates, tremendous deficit spending, and a big injection of financial liquidity.  Interest rates were already low, but have declined further due to a string of 3 Federal Reserve rate cuts.. Deficit spending — dramatically upped by the Trump tax cuts — is at record rates — nearly a trillion dollars of deficit per year. That’s a significantly higher rate of financial stimulus than Congress permitted the Obama administration to dole out after the Great Recession that started under President Bush in 2007. Also thanks to the Fed, money supply expansion (MZM) has been turned up to a very high annual rate of 7.7%. 

These are the classic steps that Economics 101 would talk about for stimulating an economy.  Rather than sending the economy into inflationary overdrive, all of the stimulus has left inflation still remarkably low.  Economists of all stripes are scratching their balding scalps about this situation.  Why is inflation still so low? (Sorry, I don’t have a ready answer.)

The second reason for the market models’ optimism is that a recession is not clearly in sight.  It is normal for the Federal Reserve to start turning on the stimulus before a recession is formally logged, but usually there are clear signs of an imminent and serious downturn (like a stock market crash hitting). This time — not so much. Plenty of prognosticators are fretting about a coming recession, but so far they have been flat out wrong.

I use several sets of economic indicators, economic surveys, and business indicators to spot likely economic and business downturns.  So far, though, there are no serious warning signs. Two of my favorite indicators at the Federal Reserve Economic Data (FRED) site still show there to be a recession probability of just a few percent.

Taken together, heavy financial stimulus and the absence of an impending recession lead the models to remain highly optimistic about the stock market.

So why has the stock market lagged behind my rosy forecasts? I don’t have a solid answer, but here are some guesses. I think all the U.S. financial stimulus has not been as effective as normal because of several sorts of pervasive anxieties — trade war fears, good chances of Democrats soon reversing Trump-made changes, Brexit, continuing fears about the Middle East, etc. I personally fear that part of the reason behind low long term U.S. interest rates is that major amounts of foreign money has been fleeing to the relative safety of the United States. I feel there is a lot of fear out there, and it is not unfounded.

All of this will change, of course.  And most probably the change in the models forecasts will be sudden and dramatic.   Hopefully models will shout their warnings several months before the stock market decides to crash. Stay tuned.

(Click on image to enlarge.)

Stock Forecast October thru March, 2020 — Still Optimistic

The statistical forecasting model says:
October, 2019:  +2% (Outstanding, but one model now has doubts.)
Next 6 Months:  +15%  (Very high again.)
Probability of at least breaking even: 96% – 98% (Excellent)
What am I doing? Fully invested since spring 2009.

These probabilistic stock market forecasting models remain strongly positive, but for the past several months the market has significantly under-performed their expectations. 

Sadly, given stark and disparate fears among investors, I expect volatility to remain high — or increase — so I doubt that the models will be very accurate for the near future. Trump, Brexit, China trade, declining manufacturing, interest rate inversion — there are plenty of quite scary possibilities out there to worry stock holders.  No one really likes it, but volatility remains a good thing for the market.

Why do my models remain optimistic?  I use several leading indicators for recessions — in general they do not see a recession coming very soon.  I have several measures of financial market panic — they are not even twitching.  Market deviation from long term trends — nope, stock markets in the U.S. are following their normal long term paths.  Federal action to quiet the economy — with high deficit spending, increasing money supply, and declining interest rates the government at several levels is stimulating the economy.

Eventually things will turn bad. Sooner or later there will always be a re-balancing. But, my models do not think it will happen soon.

Long Term Trend Lines
Both the Value Line Arithmetic Average (smaller companies count as much as the giants) and the S&P 500 (emphasizing huge companies) are within their general long term channels.  The S&P 500 continues to be on the high side and the Value Line clings to the bottom of its normal range.  No big clues to future market performance.