The U.S. stock market suffered major pullbacks in 1987, 1990, 1998, 2001, and 2007. This post looks subjectively at how well my forecasting models previewed those market traumas and the subsequent market recoveries. They did surprisingly well with the possible exception of the brief 1990 decline.
(Note that the model forecasts for 2007-2009 were made in real time, but earlier dates are evaluated with back-testing data. Also, the market data below refers to market prices at the start of the month and may not match exact market highs and lows that appear in daily market data.)
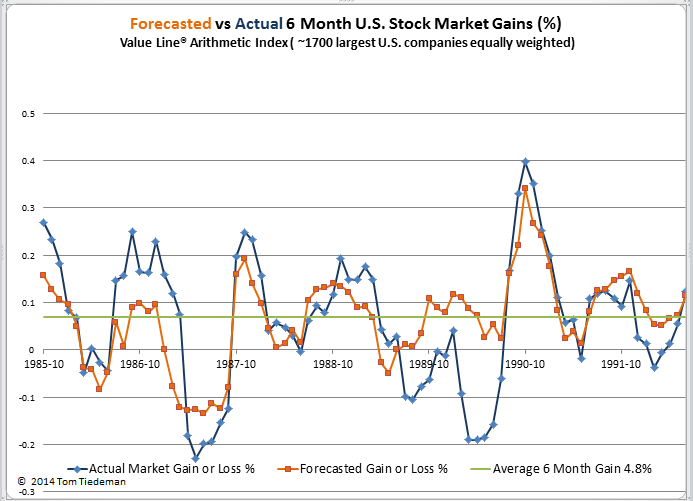
1987 Crash – A big win for the model
On “Black Monday” October 10, 1987, world stock markets crashed. The Dow Jones Industrial Average lost 22% in one day. Though most of the crash happened in a few days during mid-October, markets had started to roll over as early as August and damage continued into November. All told, the S&P 500 lost 24% from August through November and the Value Line Arithmetic Index (VALUA) lost 31%.
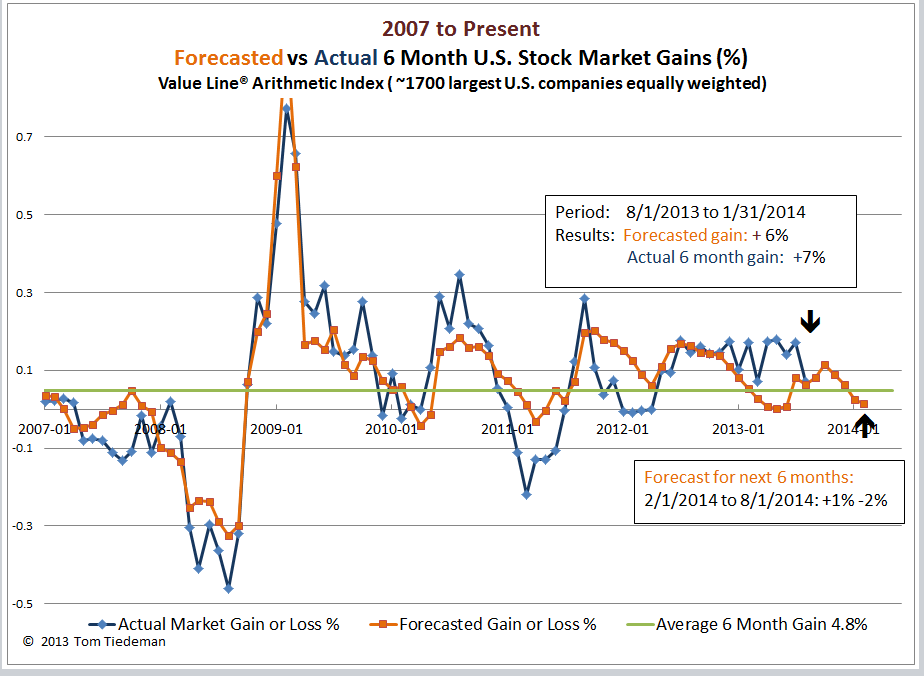
As shown in the chart below, my stock market forecasting model turned sharply negative in March 1987 – seven months before the main crash. During those spring months of 1987, markets were soaring, reaching one new high after another, but the model, correctly, saw major storm clouds forming. Then, with the market still crashing in the darkest days of October and November, the 6-month forecasting model turned strongly positive, correctly foretelling the market rebound.
(Click on image to enlarge.)
1990 – Missed the correction, caught the rebound
From May through October, 1990 the S&P 500 lost 15% and VALUA lost 24%. The forecasting model was issuing weak forecasts prior to the sharp correction, but it did not foresee the scale of the correction. On the other hand, the models did accurately forecast the remarkably rapid market recovery.
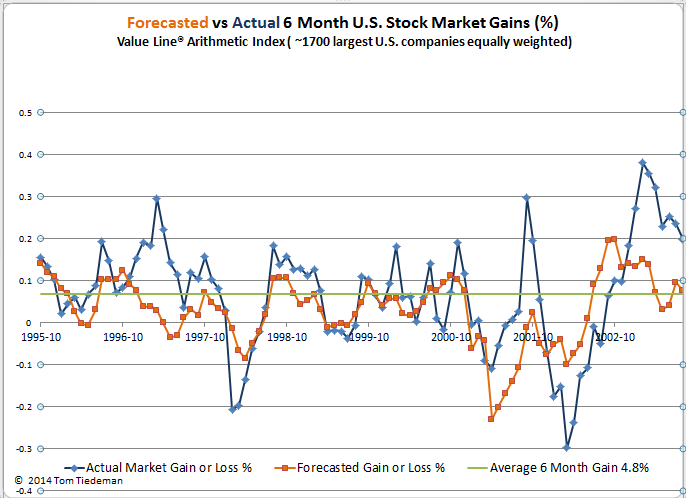
1998 correction
During the short lived market correction from April through August 1998, the S&P 500 lost 15% and VALUA lost 24%. The models issued forecasts in March and April of 7% to 8% losses in the months ahead. The actual losses that followed were approximately twice as bad as forecasted. The models got the timing of the subsequent market correction correct, but underestimated the 6-month market gains.
(Click on image to enlarge.)
2000 – 2002 Dot Com Bubble
The DotCom Bubble was a speculative buying binge focused on technology stocks – not the entire market. In total the NASDAQ Composite fell by 78%, the S&P 500 by 46%, but the VALUA suffered only a 20% drop initially. While the NASDAQ drop was nearly continuous from 2000 to 2002, the VALUA had a rebound through 2001 followed by another 26% drop in 2002 as the U.S. real economy fell into recession.
As shown in the chart above, the models’ forecasts generally matched the timing of the double-decline of VALUA during the period. The model did not expect the 2001 rebound to be as strong as it was and did not expect the second dip in 2002 to be as bad as it turned out to be. Overall, the model predicted the timing and direction of the VALUA fairly well.
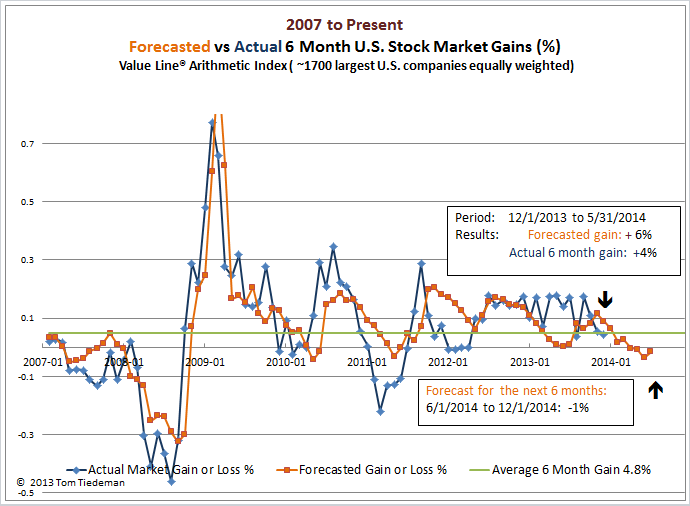
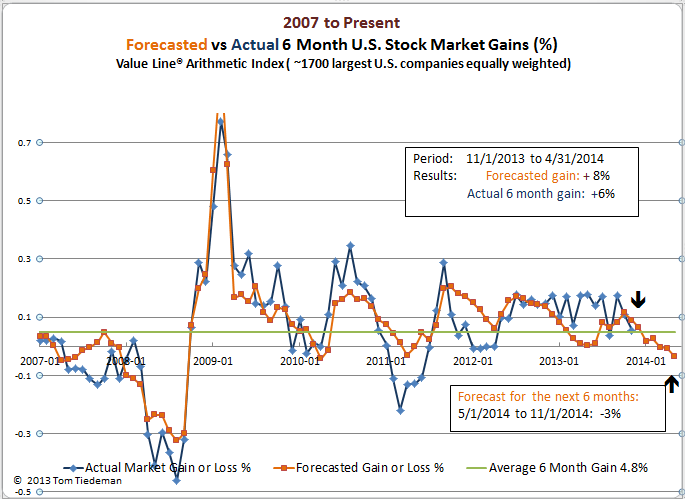
2007-2009 The Great Recession
Stock markets worldwide were traumatized by a series of financial panics and steep recessions. Between October, 2007 and February, 2009 both the S&P 500 and VALUA lost 52%. The collapse started slowly with the bulk of the market destruction occurring in late 2008 and very early 2009. Overall, the model forecasted the market well. It issued weak forecasts through 2007, but by April 2008 it was forecasting a massive 25% decline in the market, well before the steep part of the decline actually began. Likewise, in early 2009 while the market was in the steepest part of the crash, the model issued dramatic positive forecasts for the coming months, forecasts that accurately predicted the subsequent rebound of the market.
(Click on image to enlarge.)
Summary
Though the stock market models’ forecasts of these major market disruptions were far from perfect, except for the correction of 1990, they did anticipate the correct timing and general magnitude of the severe market corrections and their following recoveries.
A lesson to learn from this review, however, is that the models truly are future oriented. They do not have much value in assessing how the stock market will behave in the next few weeks. (In August you know that the weather is going to get cold by January, but that is no reason to put on your winter coat in August.) In general, the models start warning of market disasters months before actual destruction occurs, and they get highly optimistic months before markets finish their crash phase.