Author Archives: tomtiedemangmailcom

2014 Stock Market Forecast Results

Well, how far off were my model’s stock market forecasts for 2014?

Not too shabby. During 2014 the forecasts from my macroeconomic stock market models matched reality pretty well. Overall, the stock market performed a bit better during the year than the model had expected. No complaints there.

During 2014 actual market performance could be checked for 12 monthly forecasts.  The first of these forecasts was made at the start of August, 2013 with a forecast for the end of January, 2014.  The last forecast that can be checked was made in July, 2014 with a forecast for stock market performance through the end of December, 2014.  A graph of the forecasts vs actual results appears below.

In statistical terms the comparison of actual and forecasted results showed an R-squared measure of 0.35.  That corresponds closely with the long term back-tested results for the model.

But, that doesn’t mean that the model was “right” only 35% of the time.

In more descriptive terms, for most of the 6 month spans of the year the model expected the market to rise moderately and that is generally what the market actually did.  Four times during the year the model forecasted that the market would either be flat or fall less than 5%. One of these forecasts was spot on, but for the other three cases the market rose under 5%.

To my mind what matters is that the model did not make any really bad calls and mainly the stock market performed roughly as expected.  I’ll call that a win.

Happy New Year!

(Click on image to enlarge.)

Incredibly Accurate, Incredibly Simple Multi-year Stock Market Forecast and Why That is Only Modestly Helpful

Forecasting the stock market 3 to 5 years into the future can be straightforward and fairly accurate if three basic concepts are followed:

1.  Long term multi-year forecasts are inherently more accurate than short-term forecasts.
2.  Estimating the collective future of thousands of companies gives more success than forecasting just a few.
3.  Avoid forecasting areas where speculative money is dominant.

In brief, trying to forecast the near term future of just a few companies that are the focus of huge piles of fast-moving hot money is just begging for failure.

This translates to a single rule: Do not attempt short-term or single year forecasts of the Dow Jones 30 Industrial Average, the S&P 500 or the NASDAQ composite, or at least, don’t expect great accuracy if you do.  The calculation of each of these indexes is dominated by just a small number of huge companies.  Each is followed closely by millions of nervous investors all trying to beat the market and usually failing.  And speculation in each of these indexes is cheap and simple using exchange traded funds. All the makings of a frustrating forecast. Most market forecasters make their annual predictions using these popular averages, and not surprisingly, most of these annual forecasts end up being shown up as wildly inaccurate.

So what’s left?  The rest of the stock market, all the thousands of other companies whose names are not household words and people really don’t know or care much what they do.  Prices of these thousands of companies — much of the rest of the economy — collectively tend to move in a much more predictable way. They follow a path of constant moderate growth very closely over the span of several years. Not month-by-month, or year-to-year, but over a multi-year time span.

What explains this steady long term appreciation? The Law of large numbers. Millions upon millions of people work for these companies.  They go to work 5 days a week or so and they try pretty hard to do a good job regardless of whether the stock market is up or down.  Even in a severe recession most all of these workers are still plugging away at their jobs. The result is a rather predictable rate of overall corporate growth.

Like the more speculative parts of the stock market, prices of the less-speculative stocks go up and down with each bubble and recession.  Their collective price swings, however, are less dramatic and are more closely tied to economic fundamentals.

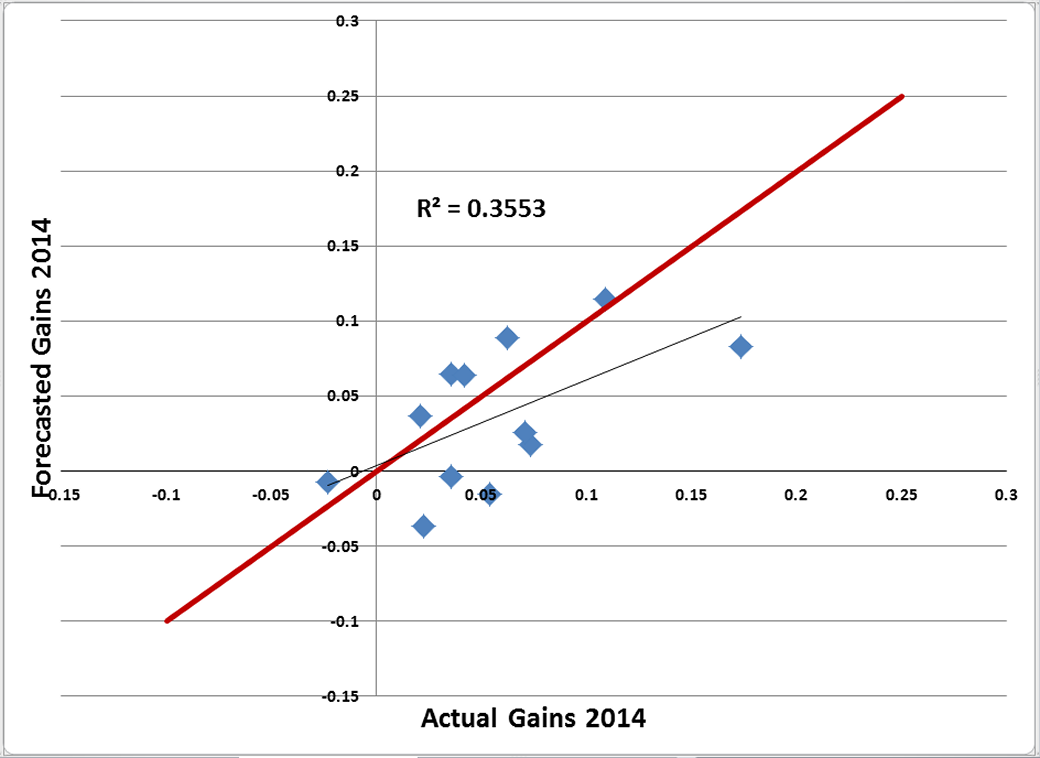
How predictable is ‘the rest of the market’?  Statisticians use a measure called R-squared which evaluates how far, on average, forecast points differ from what actually occurs.  R-squared of 1.0 is a perfect match.  R-squared equal zero or negative means the model is essentially worthless.

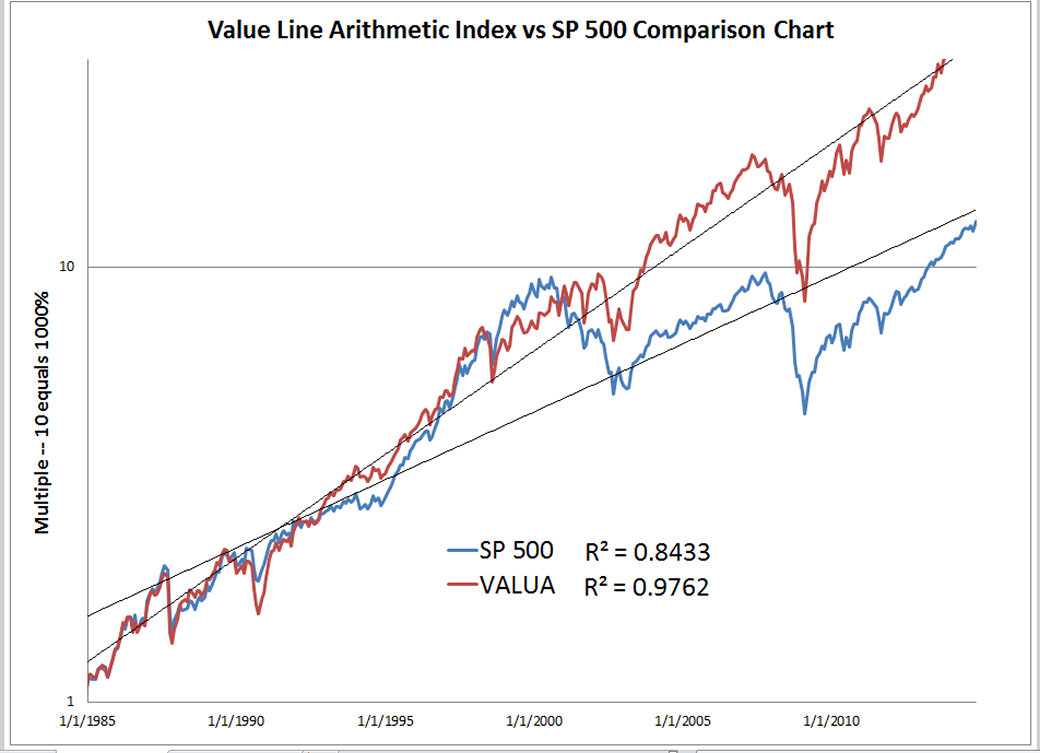
Since 1984 the S&P 500 has followed a somewhat constant rate of growth with R-squared = .84, actually pretty good. Simply put, buy and hold investing makes sense: over the long haul the index grows at a somewhat steady pace — except for all the speculative crashes and bubbles along the way.

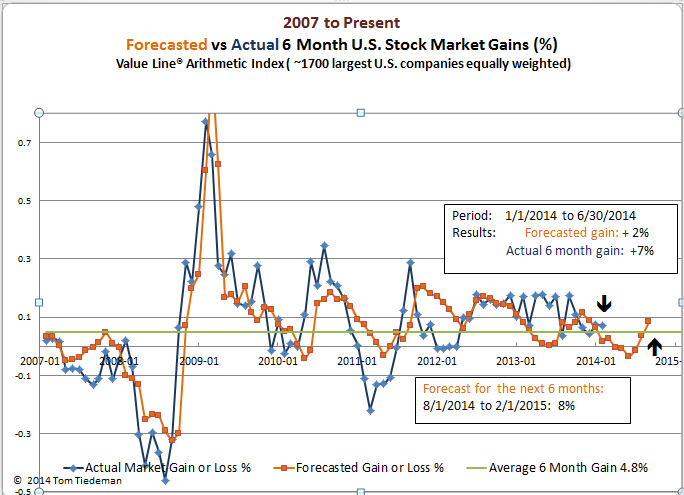
I follow the Value Line Arithmetic Index  (VALUA) which focuses more on ‘the rest of the market.’ VALUA gives equal importance to each of the 1,700 or so stocks that the Value Line Investment Survey tracks. No company is treated as more important than any other in calculating the index.  VALUA  follows a constant growth rate with an R-squared value of .98.  Not perfect, but very good. An ETF near-equivalent is the Guggenheim S&P 500 Equal Weight ETF (RSP)

`
(Click on image to enlarge.)

Looking at the graph above it is obvious that neither VALUA nor the S&P 500 follow their long term steady growth trends exactly. But, even over just a 3 to 5 year time span, the growth of VALUA has matched the steady growth trend very well: R-squared = .96.

So what? — stock indexes tend to follow their long term growth paths if you look from a multi-year perspective. Whoopie! Not news to anyone.

A more important and useful observation, however, is that VALUA has a very strong tendency to ‘regress to its mean’, to move back in line with the long term growth trend.  If the VALUA is above the long term growth trend the likelihood is that the next few years will show sub-par appreciation.  But, if the index is at or below trend, as is the case now, then average or somewhat better than average price appreciation is probable.  When the average is near the long term trend line a tremendous price gain becomes less likely. If prices do shoot up, a severe correction looms in the future.

Six Month Forecast for the U.S. Stock Market: December, 2014 to June, 2015

My macroeconomic models predict strong gains for the U.S. stock market for the first half of 2015 — not fantastic, but decidedly better than average. (Based on the Value Line Arithmetic Average)

Forecast:
Probable stock market gain 12/1/2014 to 6/1/2015:  8%  (Avg. 6 months since 1984: 4.8%)
Probability of at least breaking even :   80%  (Average for all months since 1984: 73%)

As the models assess the situation, the underlying factors that have propelled the U.S. stock market upward since 2009 remain in place.  The economy is still under-performing, but is improving. Interest rates remain incredibly low. Composite macroeconomic leading indicators are OK, but not great. Chances of a near-term recession are generally assessed as very low.  While stocks are not at bargain-prices, the odds favor continued gains.  With all the normal bumps, potholes and surprises along the way.

(Click on image to enlarge.)
Based on the most recently completed 6 month period (May through November, 2014) the stock market has been beating the expectations of the model somewhat.  The model had predicted flat performance, but the strong rally from October has netted a 5% gain.  Hopefully, this better-than-expected performance will continue into the new year.


Six Month Forecast for the U.S. Stock Market — November 2014 to May 2015

Forecast:
Probable stock market gain 11/1/2014 to 4/1/2015:  9%  (Avg. 6 months since 1984: 4.8%)
Probability of at least breaking even :   85%  (Average for all months since 1984: 73%)

The macroeconomic models are nicely positive for the coming 6 months with a decidedly better-than-average expected gain of about 9% and an 85% probability of at least breaking even over the period. (Based on the ValueLine Arithmetic Index, a 1700+ index of most of the U.S. largest corporations equally weighted.)

Despite the end of the Fed’s Quantitative Easing program, borrowing costs are still incredibly low.  Though the economy has shown a strong 3.5% growth rate over the third quarter, there is still considerable room for economic growth — GDP is still significantly below normal and underemployment remains a serious problem.

(Click on image to enlarge.)


Checking back, the six month market forecast made last April was right on target — basically flat performance. The forecast had been for zero growth for the ValueLine Arithmetic Index. Through October the Index was a few percent below the forecast. However, thanks to a sharp recovery over the past couple of weeks, the Index closed the forecasting period with a gain of 2%. For the past year the stock market has performed nearly as the model had expected, giving a mild assurance that the stock market is behaving normally.

Six Month Forecast for the U.S. Stock Market October, 2014 to April, 2015

There is some current weakness in the stock market as forecasted months ago by my models.  But, looking forward, these macroeconomic models expect the U.S. stock market to perform better than average for the close of 2014 and the winter months of 2015.

What’s driving the market?  The story hasn’t really changed in the past couple of years:  The U.S. and the rest of the World continue to slowly recover from the Great Recession.  Most economies are still weaker than normal.  Unemployment has gotten better, but is still unacceptable.  Inflation remains low. Gross Domestic Product remains below its long term trend.  Interest rates, forced down by extraordinary measures  put in place by central banks remain near historic lows. Stock valuations are high by several common measures such as Price/Earnings ratios.  There is, however, no correlation I have been able to find between P/E ratios and near term stock market prospects.

As long as the economy remains relatively weak, the stock market probably has reason for optimism.

Here is the current forecast:
Probable market gain from 10/1/2014 to 4/1/2015:  8%  (Average 6 months since 1984: 4.8%)
Probability of at least breaking even :   80%  (Average for all months since 1984: 73%).

(Click on chart to enlarge.)
In the most recent 6 month period (April through September) the model had expected the market, as measured by the Value Line Arithmetic Index, to drop 1%.  The actual 6 month change was -2%.
As you can see from the chart, forecasts for the next couple of months are weak.  After that, hopefully the market will rebound nicely.


Is Ebola a Black Swan for the Stock Market?

There is a non-zero probability that  fallout from the current Ebola outbreak will crush world stock markets in the next few months. I have no idea what that probability actually is. Maybe the chance is incredibly small and perhaps the risk is large. The experts do not appear to have a clue either.

My stock market models focus on changes to the real economy and would probably be blind to the onset of a panic-based market crash. Investor feelings are not part of the models. These econometric models, however, probably would foresee a later stock market crash that might arise in the small chance that the virus outbreak eventually destroys the world economy. Now that’s a cheery thought.

According to published reports the Ebola virus outbreak in West Africa began with one person last March and now, roughly half a year later, it has spread to an estimated 5,800 people.  So far, most of the world and certainly the stock market have brushed this off as a minor event.  Today in a major policy address to the United Nations the President of the U.S. emphasized the seriousness of the current Ebola outbreak.  This emphasis was scarcely mentioned in press reports and the stock market was up nicely for the day.

By January 20 the United States Center for Disease Control gives a best case estimate that the Ebola disease will affect 11,000 people, and in the worst case estimate the disease will devastate 1.4 million people by mid-January. Currently, 70% of those infected die from Ebola.

In the highly unlikely event that the worst case scenario further develops unchecked, (a one-to-one-million yearly growth rate) the entire population of the Earth would be affected in the following year. In the current best case scenario, Ebola would become endemic and would saddle the world economy with significant costs for the foreseeable future entailed by efforts to prevent infection and ameliorate the disease.

It seems to me that between now and January the world will see if the best or worse case scenario is developing.

Almost nobody reads this blog. That is fine with me.  But, should a well-read market commentator write a panic article about Ebola — Watch out!  Stock market valuations are lofty and there is plenty of room to fall. The market reaction from a national fear story could be sudden and severe. No commentator will want to bear the responsibility of being the first to panic. Should one signal fear a stampede could follow.

Six Month Stock Market Forecast September, 2014 to March, 2015

According to my forecasting models, the remainder of 2014 and the start of 2015 promise above average returns for the U.S. stock market as measured by the broad-based Value Line Arithmetic Index.  But first, there remains a strong probability of some mild weakness in the next couple of months.

Probable market gain from 9/1/2014 to 3/1/2015:  7%  (Average 6 months since 1984: 4.8%)
Probability of at least breaking even :    74% to 80%  (Average for all months since 1984: 73%).

(Click on image to enlarge.)

So far this year the stock market has performed slightly higher than the models had forecasted.  For the most recent completed 6 month period (March through August) the models had expected no gains, but the market rose 3%. 

There is always a possibility that the market could move sharply lower, at this stage most likely caused by world events.  That said, the models remain positive primarily because the economy still has not fully recovered from the Great Recession.   When the economy has everyone smiling, these forecasting models will turn negative.  In the meantime, most likely for the next couple of years, the models are likely to forecast continuing modest gains for the U.S. stock market.

August, 2014 Six month Stock Market Forecast

(Ignore the small stuff. Please read the disclaimer that follows this post.)

The next six months finishing 2014 and starting 2015 should be significantly better than average for the stock market. At least, that is what my stock market forecasting models say.

Why are the models optimistic?  It is mainly because there is room for the economy to improve: GDP is still below it’s potential;  construction activity remains subpar; unemployment and under employment are still too high; the chance of a recession is remote; and the Federal Reserve continues to apply low interest rates and  massive amounts of newly created money.

Today was pretty grim for the U.S. stock market — and there is nothing like a rotten day to make the forecasts coming from my stock market model brighter!  When things are bad they can get better, but when all is well, the only way to go is down. A further drop in the next month or so is still likely.

Here is the model’s stock market forecast for the tail end of 2014 and the start of 2015:

Probable market gain from 8/1/2014 to 2/1/2015:  8%  (Average 6 months since 1984: 4.8%)
Probability of at least breaking even :    84%  (Average for all months since 1984: 73%).

For the past year or so the stock market has been performing roughly 5% better than the models had forecasted. You can’t complain about a strong market, but the model suggests that investor optimism has been building up and some sort of pullback remains likely.  Beyond that the broader prospects for the U.S. stock market are better than average.

(Click on image to enlarge.)

(Disclaimer: Please do not pay much attention to these 6 month stock market forecasts until there is a great big forecast coming from the models that completely contradicts how the market is currently moving. When you feel the forecast is crazy, that is probably the time to give the models’ forecasts some real consideration.   Until then, not so much.  The’ noise’ of normal market vibrations is probably greater than the ‘signal’ coming from economic fundamentals. Yes, the market can be very crazy in the short term and the models simply are not that accurate. The forecasting models presented here are not precise and the losses that come through high taxes on short term capital gains will kill any real gains coming through short term market maneuvers.)

Three reasons the stock market may not peak before 2016 or 2017

Many commentators say today’s stock market is seriously overvalued. I do not disagree, but three major factors indicate that the bull market will probably continue for well over a year, probably until 2016 or 2017.

First, the skeptics. Either the market cynics are right, or they are creating the greatest Wall of Worry that I have ever seen. There are many shouts of warning, but I will just point to two of them. Mark Hulbert at MarketWatch.com cites six factors that indicate the current market already is priced higher than the vast majority of prior market peaks.  The factors are: price/earnings ratio; price to 10-year cycle price/earnings ratio; price/book ratios; price/sales ratio; Tobin’s Q ratio; and relative dividend yield. Neil Irwin in the NY Times goes further, writing “Welcome to the Everything Boom, or Maybe the Everything Bubble.”  Few of the naysayers are pointing to an imminent market crash, instead they generally stress that high current valuations point to disappointing overall market growth over the next decade or so. 

So, when will the over-priced stock market come crashing down? Hopefully, my stock market models will scream warnings a month to six months ahead of the eventual market collapse. Or, at least, hope of an early warning is the main reason I created forecasting models in the first place. In the meantime the models have not turned seriously pessimistic.

The economy still has not fully recovered from the Great Recession.  As shown in the graph below Real Gross Domestic Product suffered the worst decline in several generations during the recession.  It has been recovering, but it still has not equaled Real Potential GDP.  The Congressional Budget Office has generated the Real Potential GDP calculation for many years and the match with actual GDP results has been incredible — the Coefficient of Determination, R-Squared, is greater than .99! That is amazingly close. Maybe everything truly is different this time, but more likely, GDP will ‘regress to the mean’, reaching its potential before the next market crash. Increasing employment by increasing GDP, after all, is what the massive intervention of the Federal Reserve has been trying to accomplish.

Three things need to happen for GPD to reach potential: employment needs to increase, both for the unemployed and the millions of workers currently underemployed;  business investment must rise.; and world trade needs to get back to normal, meaning that the rest of the world needs to recover from the recession as well. At best, it will take a couple of years before GDP (i.e. the economy) is back to normal performance.  There is still plenty of slack in the economy leaving room for stock prices to grow.

(Click on image to enlarge.)

Interest rates need to rise 3% or more.  The Federal Reserve and other central banks promote economic growth by lowering interest rates and increasing the money supply. Raising interest rates and limiting lending cools down the economy, often dramatically.  The graph below shows the U.S. bank prime lending rate from 1950.  The overall story of the graph is that raising interest rates by 3% to 5% above the previous low point is enough to slow the economy and bring on a recession.

Typically, the Federal Reserve takes a year or more to increase lending rates enough to slow the economy. Then, the impact of higher interest rates takes roughly a year before it shows in the real economy.  The Fed already has indicated that it is unlikely to start increasing interest rates for another half year.  Once the rate increase process has started it likely to proceed very, very slowly.  Otherwise, trillions of dollars in outstanding long term loans will plummet in value, exposing the world to a financial crisis similar to 2007 – 2008.  Overall, it seems unlikely that interest rates will increase in the next 2-3 years enough to slow the economy.

(Click on image to enlarge.)

Speculative fever needs to build.  Margin Debt, is money that investors/speculators borrow from their brokers to use to buy more stock.  As such, the Margin Debt level is a solid measure of investor optimism. Margin Debt has a long record of fairly steady increase as the total capitalization of stocks has increased. In fact, Margin Debt follows a path of simple compounding growth extremely closely. (R-squared = .99).  But, the match with simple exponential growth is not perfect.  The graph below shows New York Stock Exchange reports of margin loans, but the factor of steady growth over time has been removed. The result is a chart showing how margin levels at any point in time compare to the base value of regular steady growth.  The general picture is that in the case of most significant market collapses, margin debt increases for a period of several years prior to a crash.  The last few months usually see margin debt shooting up as speculation reaches frenzy levels. Generally, margin has grown to a level of 50% above trend before the speculative bubble bursts.  Current levels of margin debt have not even reached the long term trend level.  If the current market cycle is in any way typical, margin will increase for a couple of years or more before getting to a breaking level.

Stock Market continues to beat forecasts

Six months ago my stock market forecasting models predicted that the first half  of 2014 would be nearly flat — just a 2% gain.  Instead, the market (as measured by the broad based Value Line Arithmetic Index) rose a quite respectable 7%.

Why is the market beating the models’ expectations? My best guess is that the it is perfectly clear to all that the Federal Reserve has no intention of letting the economy stall in the near term.  So much the better!  It looks like it will be a long time before the Fed takes the punch bowl away from this party.

My 6 month stock market forecast for the second half of 2014 is slightly more positive than last month. The prediction remains muted, a bit worse than the long term average. 

Probable market gain from 7/1/2014 to 1/1/2015:  2% to 4%  (Average 6 months since 1984: 4.8%)
Probability of at least breaking even :    65%  (Average for all months since 1984: 73%).

For the past year most of the surprises have been positive, so I would not be surprised if that happened again.

(Click on image to enlarge.)