Summary:
Current prospects for the U.S. stock market are very good: 9% gain over the next 6 months with an 85% probability the the stock market will at least break even. Immediate prospects are fine (more on this later.) Maybe the whole world will blow up next week. I don’t know. But, based on roughly 40 years of stock market history, conditions for the U.S. stock market are likely to be favorable.
So, this is a pretty nice forecast– not as good as the fantastic forecasts that came with recovery from the Great Recession — but, still really good compared to long term averages and somewhat typical of this time of year. For this year, this is probably as good as it gets.
Enjoy your holidays and be nice to other people! I love both of my readers and wish them well in the coming year!
Detail:
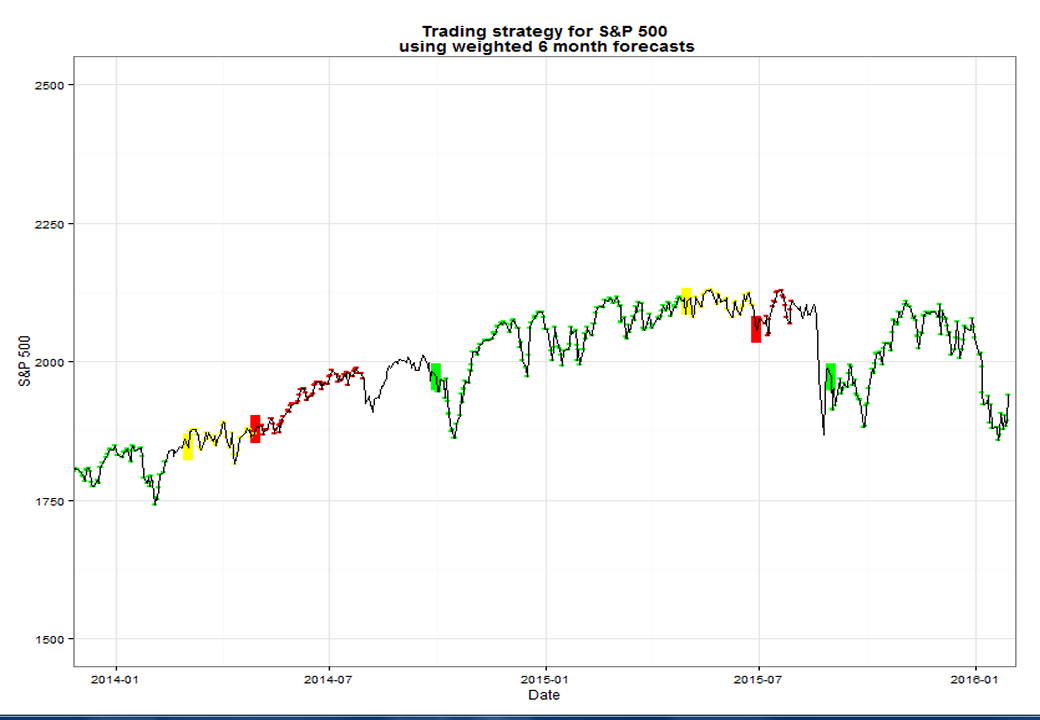
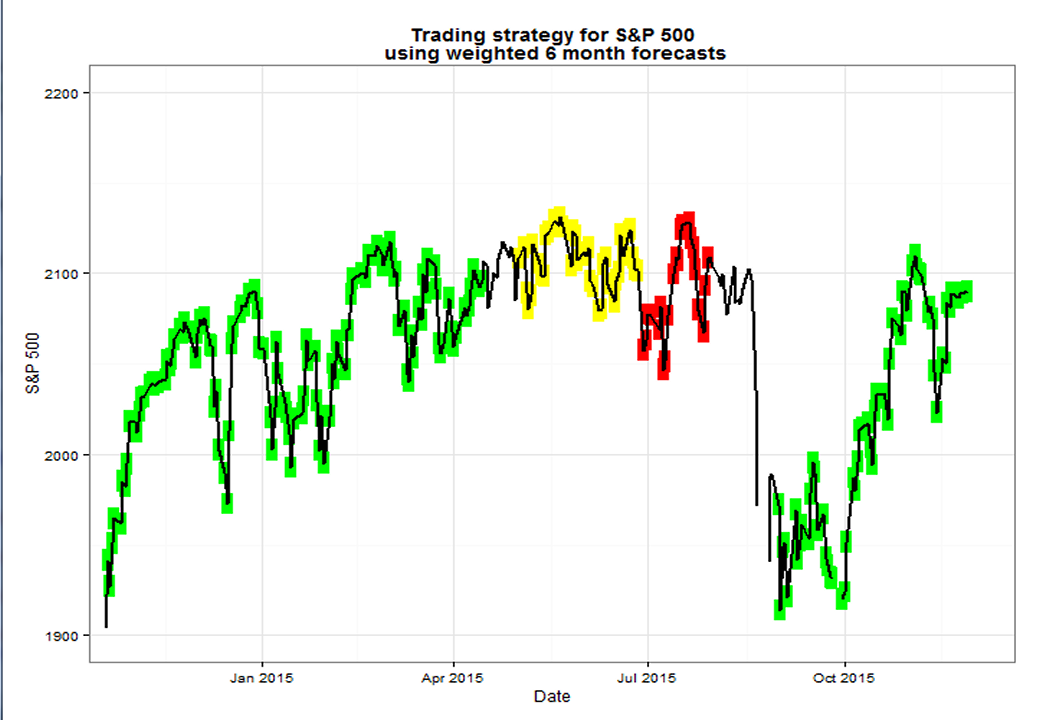
There is a graph below that, I hope, will become a regular part of this monthly blog. It shows day-to-day prospects for the stock market in the near future. (Please regard this graph of near term stock market prospects with some suspicion. This is new stuff. The formulas need to prove themselves over time. Be careful with your money. )
Hopefully, what you will see going forward with future months of the graph is: Two months, or more, before a ‘significant’ market trauma, a yellow marker should start to appear. Then, (hopefully) a month or more before a market stumble, a red flag should start waving. There will also be an indication of how bad the next market tumble is expected to be. The picture moves slowly so you shouldn’t need to hold your breath.
At least, that is how the scenario for this near term forecast graph played out this past summer. And, that is what our back-tests showed to often occur.
How can the chart ‘predict’ the future months of stock market behavior ahead of the fact? The answer is easy. The model is simplistic. The model is almost exclusively based on a small number of long term economic fundamentals. It takes time for the gigantic world economy to actually show the results of either world events or government policy actions. But, investors are on their own time schedules. Historically, investors do not react initially to the full import of new developments in the real world. Sure, there is a stock market blip to match every news event — but that is not the ‘considered’ view of millions of investors. Overall, investors tend to wait for confirmation in ‘numbers’ coming from the real world (with a reporting time delay) to see what is going to happen next. So, typically, investors react late, and they all react together — resulting in a sharp crash or some other market perturbation. The model, on the other hand, being too ‘stupid ‘to listen to stock market pundits or ponder over either astrology or ‘technical analysis’, assumes that what is “probably going to happen” actually will happen, and happen when it typically happens And, surprise! The typical result usually does happen just about as it usually does.
What the chart, hopefully, shows is that in the past summer a fairly small correction was expected, and that is what occurred. There was plenty of notice for those following this chart. Right now, things look pretty good.
(Click on image to enlarge.)
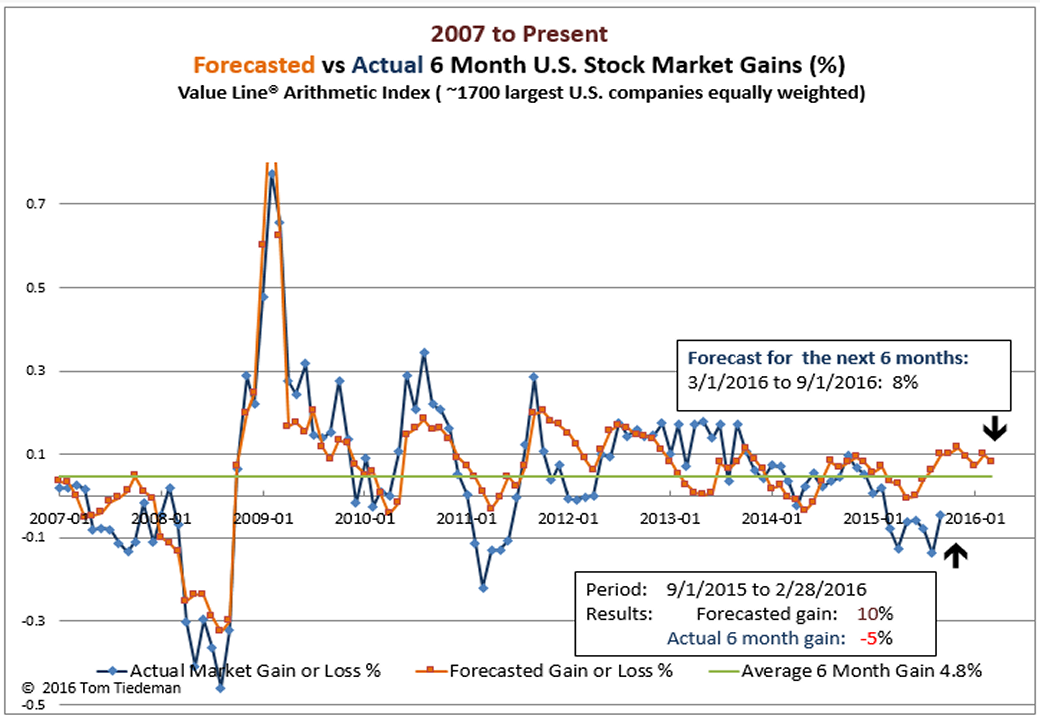
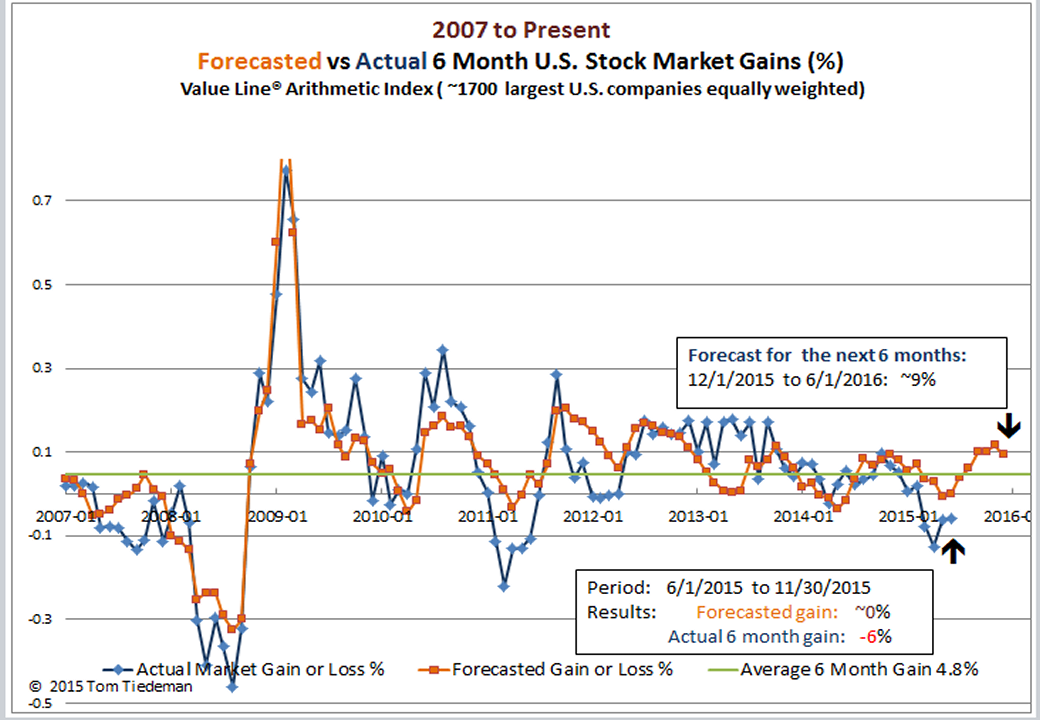
So, let’s turn to what is likely to happen to the market in the next six months. Here is what is coming up. The models’ 6-month U.S. stock market forecast: (much better than average)
U.S. Stock Market Forecast (Value Line Arithmetic Index):
Probable stock market gain 12/1/2015 to 6/1/2016: 9% (Avg. 6 mo. gain since 1984: 4.8%)
Probability of at least breaking even : around 85% (Average for all months since 1984: 73%
My reason for writing this blog is to track how well my econometric stock market models actually perform. (It has been about 8 years so far. At the start I was considered to be crazy, but now that case isn’t so clear.)
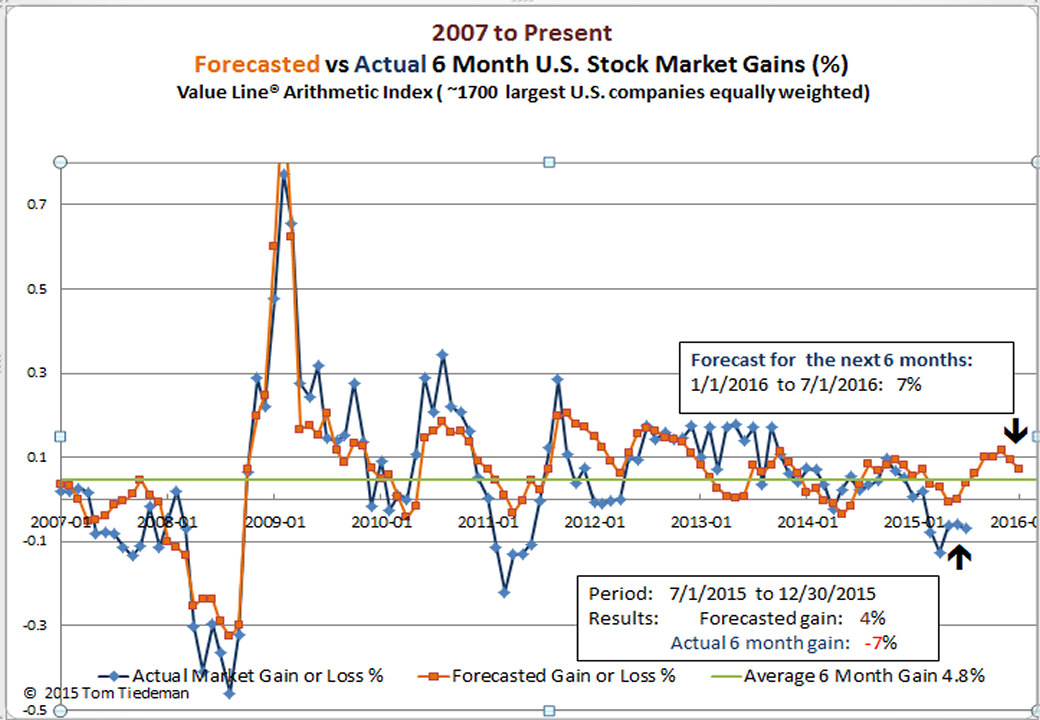
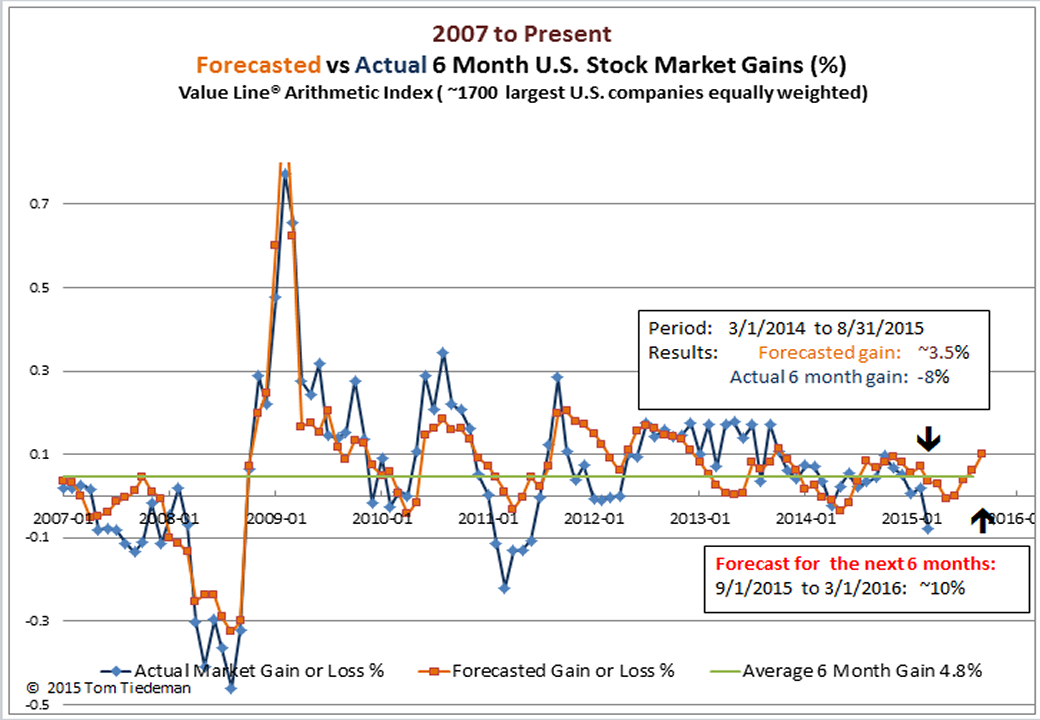
So, how have the models’ forecasts been matching reality in the past half year? Judging from the graph below, it appears that the forecasts this year have basically been on-track. The forecasts from December through May, had been for a weak first half of 2015. Well, the market did weaken, but the market fell more than the models had forecast. Look at the graph below and you will see that this happens frequently — the models expect seasonal weakness, but, to compensate mathematically for those infrequent years with super summer performance, the models dial back their average forecasts.
Here is the lesson: as a rule, the market will usually perform worse than the models negative forecasts and will perform better than the models positive forecasts. At least, that is the way I see the graph below.
(Click on image to enlarge.)