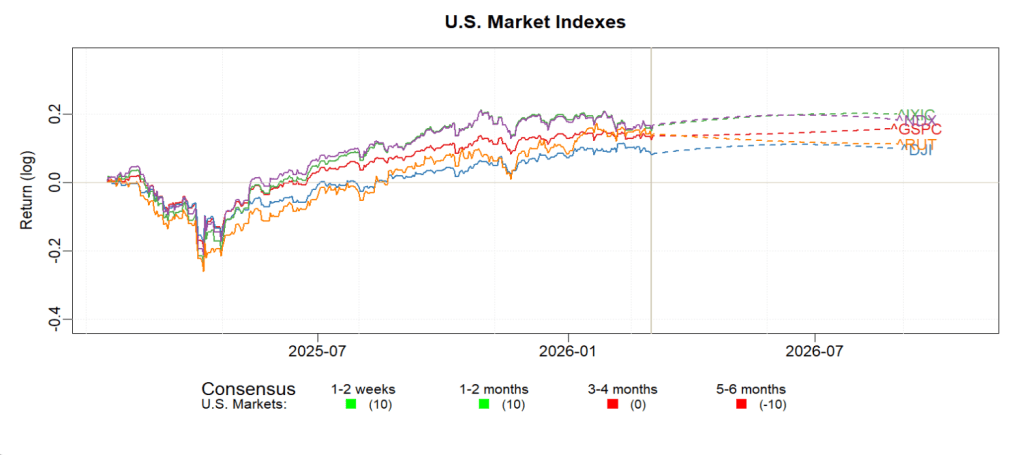
I have a new market summary graph that requires a bit of explanation. It shows 1-year historical price plots for the major U.S. market averages (S&P 500, NASDAQ, Russell 2000, Dow Jones 30) along with my 1-week to 6-month forecasts for each. They are increasingly flat. (As you will notice, I still have not avoided overlapping the labels for each Index. Sorry.) What is new, is the Consensus indicator below the graph. This Consensus indicator needs a bit of explanation.
When I started this blog nearly 2 decades ago, I had one set of formulas that made forecasts for a single market average (Value Line Arithmetic Average) for a single period (6 months), and I ran the evaluation once a month. Then in 2023, things exploded. I now run many thousands of models for over a thousand stocks, ETFs, and Indexes. The models involve a vast array of economic data and cover a full time span from one week, through a year. The models run at least daily. And instead of having a single model to make an analysis, every forecast evolves from consensus decision from increasingly large competing swarms of analyses. (I keep having visions of all the flying monkeys in the 1939 Wizard of Oz. Disturbing. They all work for me now.)
So, the 5-6 month Consensus value on the chart is the new ‘swarm vote’ of roughly 50 seperate and distinct analyses performed in different ways , often using distinctly data streams. For simplicity, I limit the vote tally to a range from +10 to -10. In today’s chart, the swarm was lopsidedly negative for 6-month market prospects (-10), but just slightly negative for the 3-4 month period (0). For shorter time frames, the group view remains positive (10).
The way I choose to read the Consensus reading is that our aging Bull Market is starting to show signs of weakness. The immediate forecasts are positive, but it is time to start paying attention. Surprise negative events ( massive oil supply disruption thanks to the U.S. attacks of Iran) are now much more likely than big positive surprises. It is a good time to be taking profits and reduce risk exposure.
If, or when, the 1-2 month and 3-4 month indicators seriously flash red, it will be time to take cover. And not wait for any 1-2 week warning.
The air attacks on Venezuela and Iran reinforce the need for humility regarding these forecasts. Even though these forecasting tools are gaining sophistication, they never can predict the unknowable or even the simple unknown. Caution is wise.
