In May the market indexes popped back up nicely — which my forecasts were not expecting. That’s why my musings are free. It is only sometimes that they are right.
The model forecasts for June are flat to down a point or two. For the next 6 months the forecasts are mildly positive the the NASDAQ Composite and NASDAQ 100, essentially flat for the S&P 500 and down a few points for the broader market averages.
The primary reason these statistical models for the past half year have been pessimistic stems from the Federal Reserve’s interest rate increases that started just about two years ago. At no point in the past several decades has the Fed increased rates as much or as quickly as this round. Short-term interest rates are now higher than long-term rates, a so-called “rate inversion”; and there never has been a rate inversion as deep or as long-lasting as the present one.
In every other instance of a rate inversion there has been a major stock market decline. Typically, the stock market decline happens fairly soon after the Fed starts to reduce rates again, usually in response to negative economic data.
This time may well be different and maybe that explains why the models have been overly pessimistic. Even while raising interest rates, the Federal Reserve sent trillions of dollars to banks to temporarily prop up their reserves (“reverse repos”). A major bank crisis was largely averted. The Fed also has slowed the rate at which they are reducing their bond portfolio, another positive. And, perhaps most importantly, Federal deficit spending remains incredibly high, effectively providing a major economic stimulus.
Before the U.S. elections any significant Federal Reserve actions or Federal Government spending changes seem highly unlikely. Come the New Year, the picture will be entirely different as the Trump era income tax cuts are due to expire. At the very least, investor fears will skyrocket. But, that’s not now. For now the relevant economic news is not too bad.
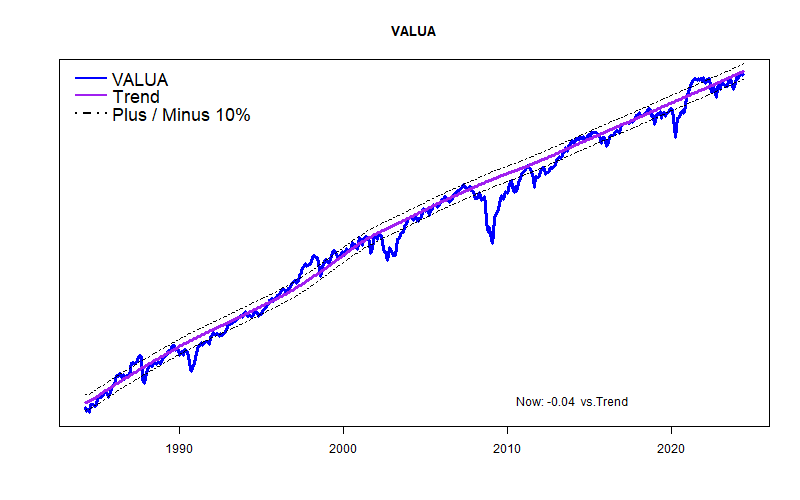
Looking at the long-term trend lines, the S&P 500 is about 8% above the long term trend and the Value Line Arithmetic Average is 4% below trend.