Value Line Arithmetic Average VALUA +0.7% (BELOW average)
Dow Jones Industrial Average ^DJI +7% (-0.01 to +0.14)
S&P 500 Index ^GSPC +6% (+0.01 to +0.13)
NASDAQ Composite ^IXIC +10% (0 to +0.10)
NASDAQ 100 NDX +5% (-0.04 to 0.14)
Russell 2000 ^RUT +6% (-0.09 to +0.21)
Next 3 Months: Rest of summer for VALUA still looks mildly negative.
VALUA Probability of at least breaking even: 50% (46% to 57% – Weakening )
ETFs Alpha Test posted HERE
The most tested of my forecasting models, for the Value Line Arithmetic Average (VALUA) are much less positive than just a month ago. The models expect the broad VALUA market gauge to stay flat or drop a bit through the end of the year. My more recent models for a large number of stocks still are more positive, especially for tech stocks. I trust the older models more than the new ones. Going forward, less optimism seems prudent.
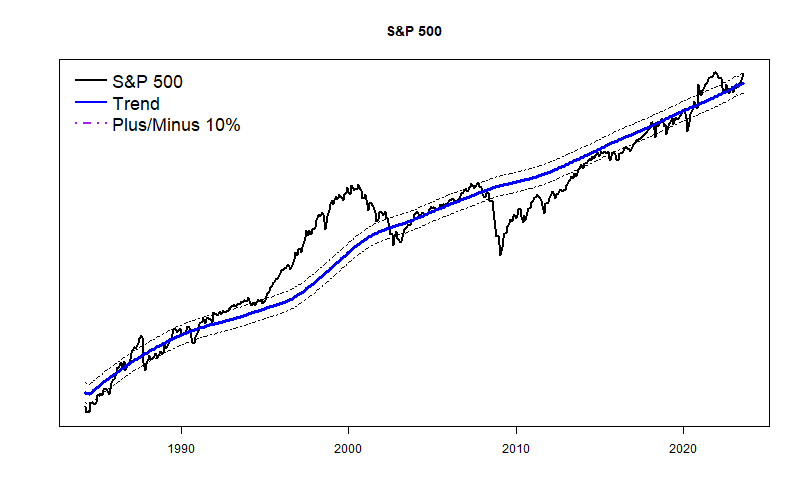
The problem going forward is that the market has been so strong this summer — resulting in less probable gain going forward. The long-term S&P 500 graph makes it appear that prices are getting a bit frothy. Could be we are seeing a new market bubble develop.
As noted above, I finally have started posting 6-month forecasts for a large number of Exchange Traded Funds. I am cautiously optimistic, but I want to emphasize that these forecasts have not been tested in real-time. They may be dead wrong. Please email me any comments or questions you may have at TomTiedeman@gmail.com. With time we will see if any of these pan out.
