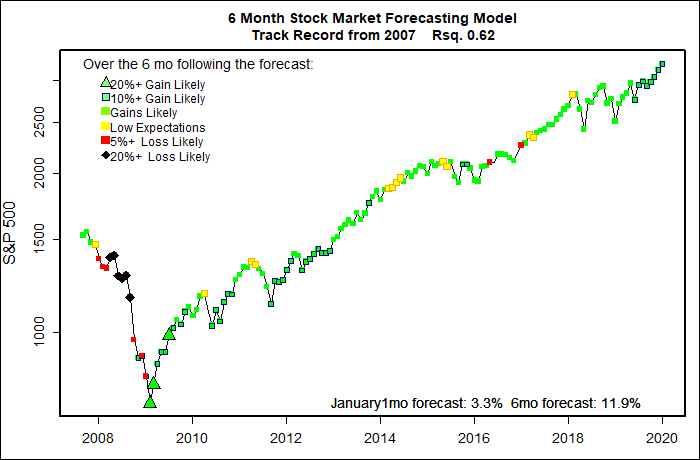
The statistical forecasting model says:
January, 2020 +3.3% (Very good, but January is always hard to predict.)
Next 6 Months: +11% (Excellent, not quite as optimistic as last month.)
Probability of at least breaking even: 95% – 97% (Still great.)
What am I doing? Fully invested since spring 2009, but preparing to worry later in the year.
A headline at MarketWatch.com this week spouted: The U.S. economic expansion will last ‘many more years’ and 2020 will be good for stocks, says prominent economist. That kind of grand claim always seems to come back sooner or later and bite the author on the butt. Reminds one of the eternally quoted statement by noted economist Irving Fisher that “stocks seem to have reached a permanently high plateau”. Fisher’s words came, of course, in early October, 1929, just a few weeks before the Great Crash of 1929.
For the past several months the projections by the several flavors of my predictive models have been strongly positive — more positive that I had expected. The expectations seem to have been largely on track — stock market performance through the fall and to the end of the year has been stellar. And, the current forecasts from my 6 month stock market models remain strongly positive. That’s the good news.
The bad news is that two of my favorite predictors of an economic recession have ticked up for the first time in about a decade. The increased risks of recession have not been enough to reduce these 6 month market forecasts. Yet.
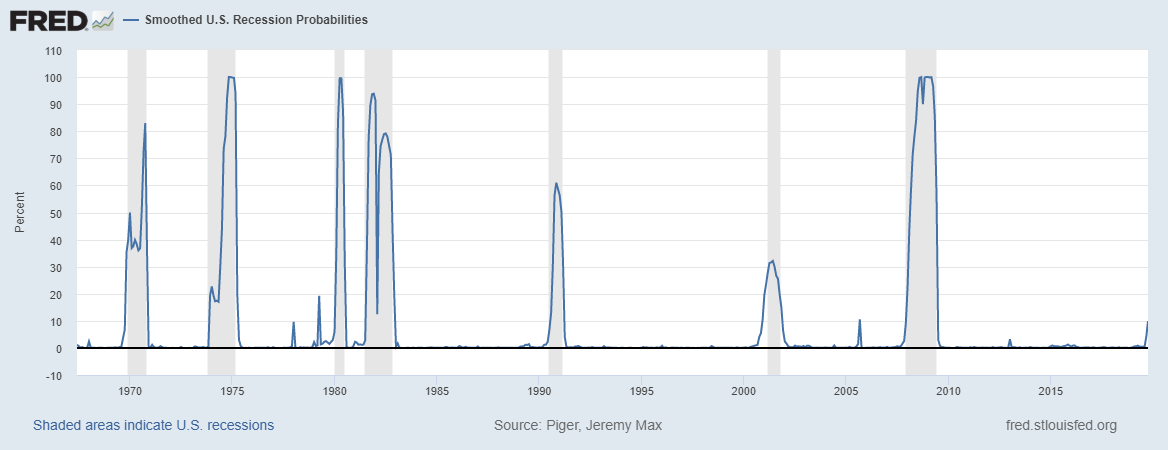
I don’t know if the stock market will tumble — or jump up — later in the year. The models only look ahead 6 months at a time. The current direction, and the models’ predictions are for a blow-off top over the next few months. Come February I expect to have a much clearer picture of how the market will perform later in the year. A recession either will, or will not come into focus. My personal hunch (and not the models’ predictions) is that the end of 2020 will be very difficult. I am not changing my investments until the models turn decidedly negative.
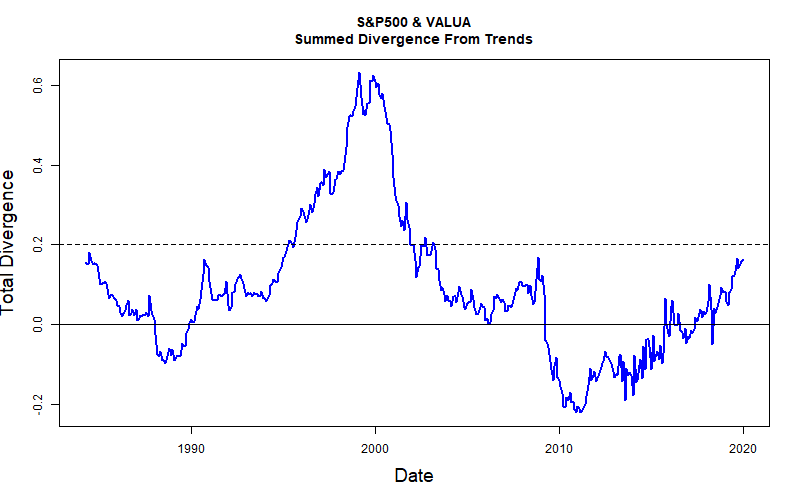
Long Term Trends
The S&P 500 remains nearly 12% above the long term trend for the index. The Value Line Arithmetic Index performed well in December — it remains about 4% below the long term average, but that is better than last month. Overall the divergence between the S&P 500 and VALUA has decreased — and that is a good thing! Neither index is far enough from its long term trend to indicate a serious market problem. By way of comparison with a totally different market metric, the Market Fair Value Graph at MorningStar.com indicated the market is about 4% above fair market value — not a serious problem.


Happy New Year to both of my loyal readers! Hang on tight!
