The statistical forecasting model says:
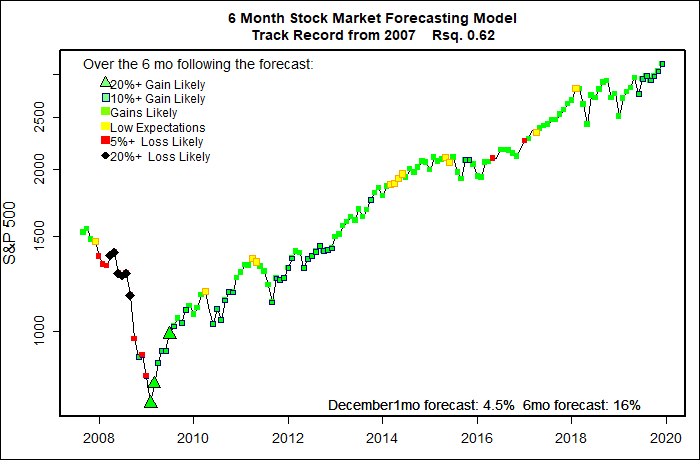
December, 2019: +4.5% (Outstanding.)
Next 6 Months: +16% (Very high.)
Probability of at least breaking even: 96% – 99% (Excellent)
What am I doing? Fully invested since spring 2009.
The month-by-month string of positive forecasts coming from my computer models is getting boring, and it concerns me some. The forecasts continue to be exceptionally positive; the market does go up; but the actual market increase is weaker than my forecasts.
The predictive models see that the federal government is injecting huge amounts of stimulus into the economy (low interest rates, corporate tax cuts, RAPIDLY increasing money supply, deregulation) but the stock market is responding less than typically would be expected given the amount of joy juice mixed into the punch bowl..
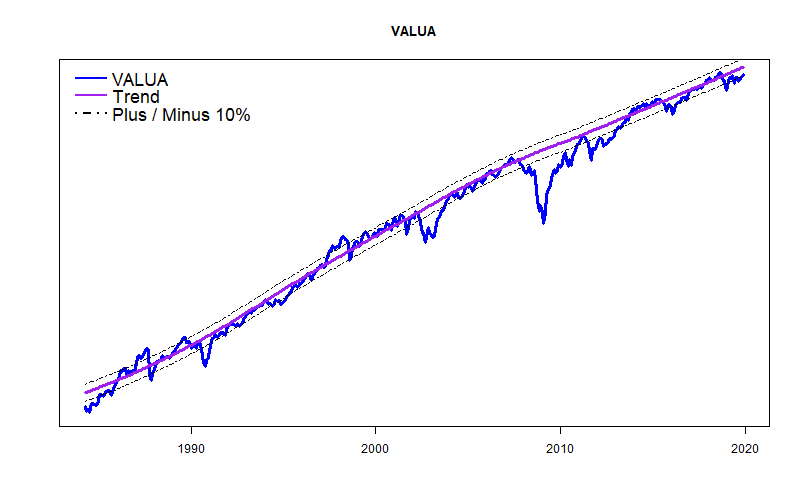
The situation is a bit complicated. The mega-cap stocks of the S&P 500 are doing pretty well — they are performing roughly 10% better than their long term performance trend. But, the less sexy stocks of the Value Line Arithmetic Average (the metric that my models are specifically designed to forecast) are dawdling along at roughly 10% below their long term trend line. (Look for a mid-December post that will address this growing divergence between the S&P 500 and Value Line.)
Long Term Trends
(See the “Long Term Model” tab above for a discussion of how the long term trend lines are created.)
For months the Value Line Arithmetic Average (VALUA) has been plugging along fairly steadily at about 10% below its long term trend line. That is not normally a big concern. There appear to be plenty of instances in the past when average appears to “bounce” back up from that level. But, the few times when VALUA does not bounce — those have been major market crashes.
However, if you look at the performance of the S&P 500 compared to its long term trend line, the difference is clear: unlike VALUA, the S&P 500 has been hugging a line at about 10% above its long term trend.
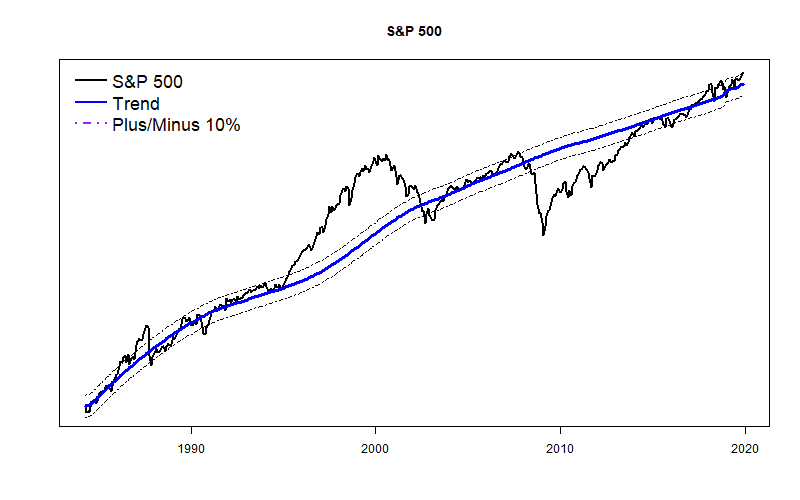
The total performance divergence between the S&P 500 and VALUA is now roughly 20%. Not an immediate cause for alarm. But, if the divergence grows significantly, it will show that either: 1) the S&P 500 is moving into a blow-off market top, or 2) the market is heading into a major tailspin.
Don’t hold your breath, but this bears watching over the coming months.
Whatever happens, my money rests on following the predictive models. They remain highly positive.
