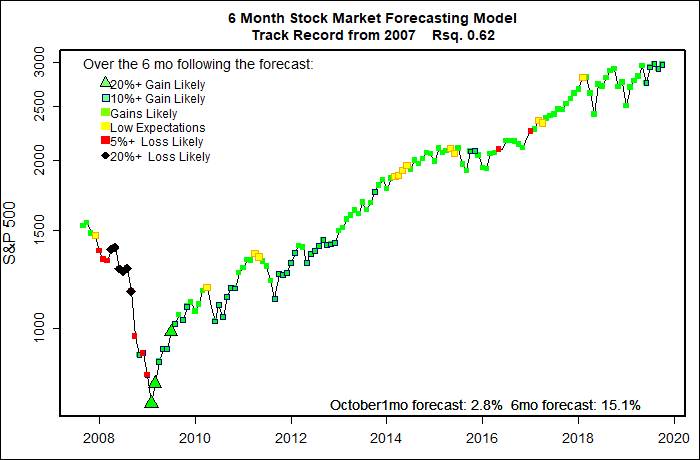
The statistical forecasting model says:
October, 2019: +2% (Outstanding, but one model now has doubts.)
Next 6 Months: +15% (Very high again.)
Probability of at least breaking even: 96% – 98% (Excellent)
What am I doing? Fully invested since spring 2009.
These probabilistic stock market forecasting models remain strongly positive, but for the past several months the market has significantly under-performed their expectations.
Sadly, given stark and disparate fears among investors, I expect volatility to remain high — or increase — so I doubt that the models will be very accurate for the near future. Trump, Brexit, China trade, declining manufacturing, interest rate inversion — there are plenty of quite scary possibilities out there to worry stock holders. No one really likes it, but volatility remains a good thing for the market.
Why do my models remain optimistic? I use several leading indicators for recessions — in general they do not see a recession coming very soon. I have several measures of financial market panic — they are not even twitching. Market deviation from long term trends — nope, stock markets in the U.S. are following their normal long term paths. Federal action to quiet the economy — with high deficit spending, increasing money supply, and declining interest rates the government at several levels is stimulating the economy.
Eventually things will turn bad. Sooner or later there will always be a re-balancing. But, my models do not think it will happen soon.
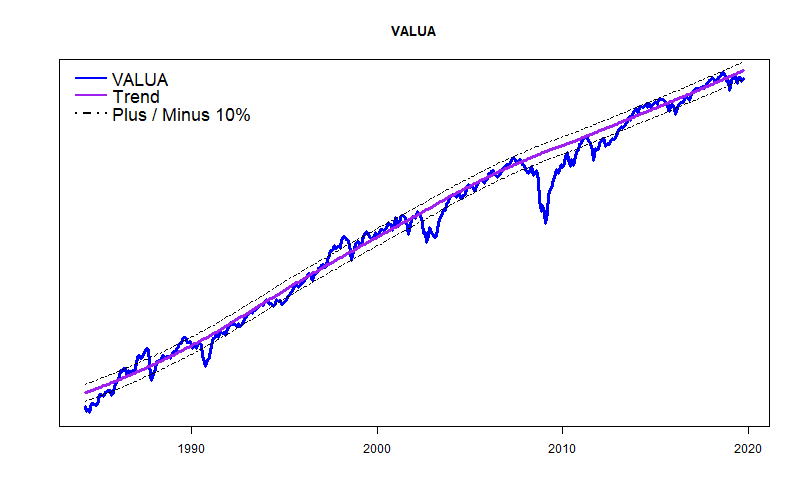
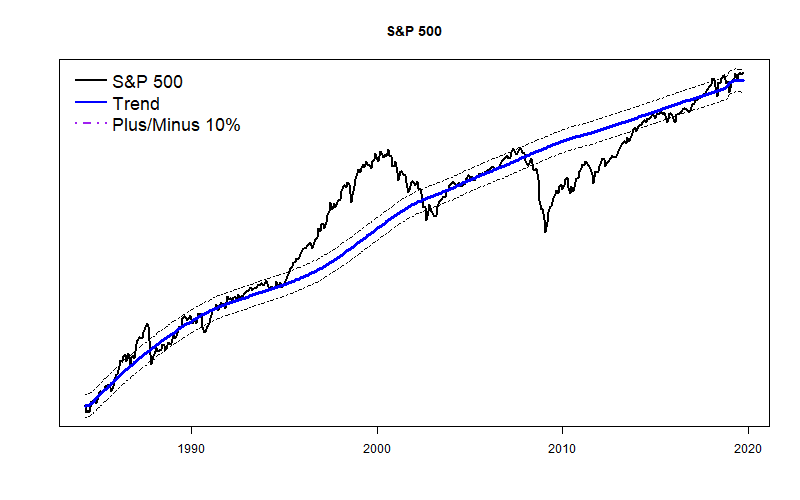
Long Term Trend Lines
Both the Value Line Arithmetic Average (smaller companies count as much as the giants) and the S&P 500 (emphasizing huge companies) are within their general long term channels. The S&P 500 continues to be on the high side and the Value Line clings to the bottom of its normal range. No big clues to future market performance.