The statistical forecasting model says:
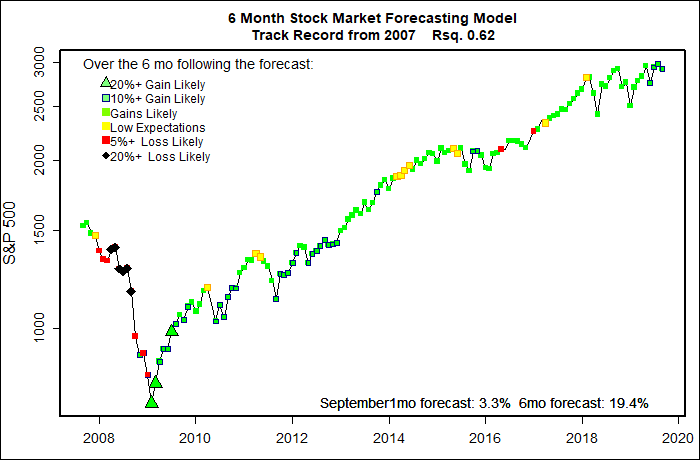
September, 2019: +3% (Outstanding.)
Next 6 Months: +19% (Very high!)
Probability of at least breaking even: 96% – 99% (Excellent)
What am I doing? Fully invested since spring 2009.
How low can interest rates go? And stay low for how long? Those are the big questions for the economy and the stock market. I wish I had an answer, but I don’t. Further declines in interest rates could spark a spectacular stock market rise, while rate increases could bring on the next big recession. It feels to me like we are balanced on a knife edge.
My gut emotions about the stock market have a long and solid track record of being flat out wrong. Time and time again I misjudge the situation. For example, I have been scared stiff for well over a year about buying long term bonds. I was sure that interest rates would have to rise sooner or later and that would send the value of long term bonds crashing. But, so far this year long term bond funds are up about 25%. Much better than the stock market!
My lousy gut-level forecasts are why I built my stock market forecasting models over a decade ago. The models combine the most probable impacts of about a dozen economic / business / investor-emotion variables and arrive at statistical forecasts of what is most likely to happen next. The effects of every factor I use have proven statistical validity since at least 1984. Most of them have been tracked since at least the 1960’s. Together they form a group of similar models that forecast what the stock market is most likely to do next.
The current contrast between my gut reaction to the market and my models is black and white! My gut worries, but the models remain wildly positive about the path of stocks for the next half year.
One thing I use to comfort myself is my faith that volatility is actually good for the stock market. Volatility makes it unlikely that the market will settle into a complacent trend that will take it far off the track that the economy would justify. Given the reality show President we have, high market volatility is near certain. Unpleasant as market volatility can be, it is probably a good thing for now.
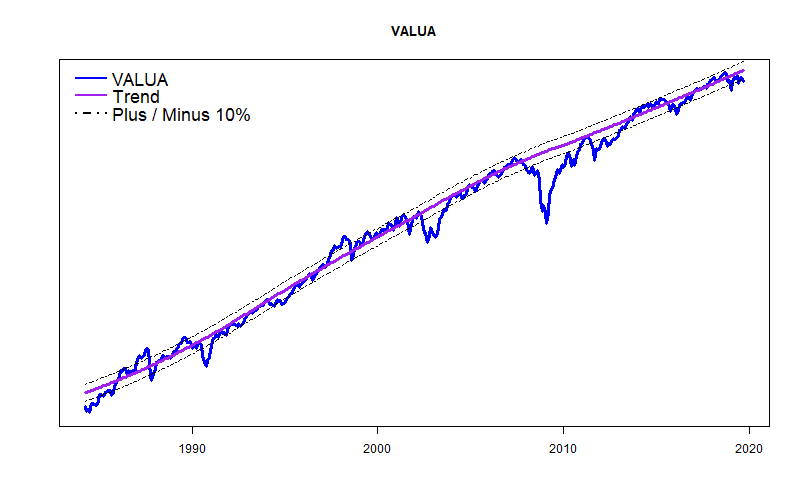
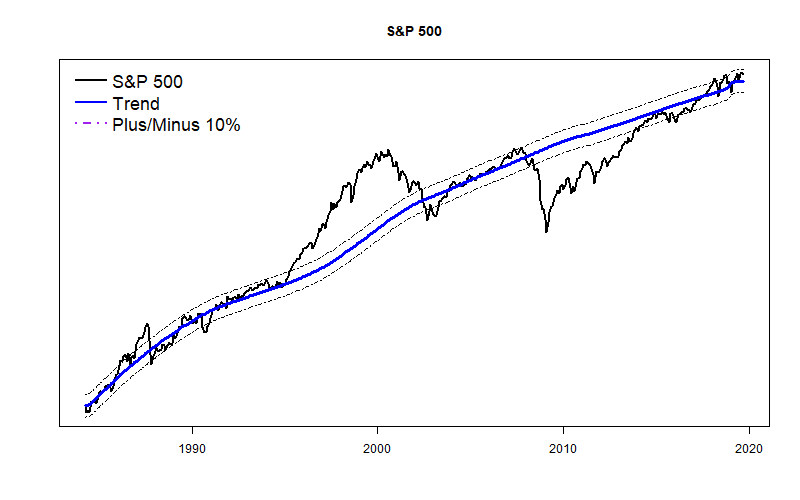
Long Term Trend
The S&P 500 trend is well within its normal trend zone. But, the much more predictable Value Line Arithmetic Average is right at the lower boundary — 10% below its many decade trend. Good reason to be concerned.