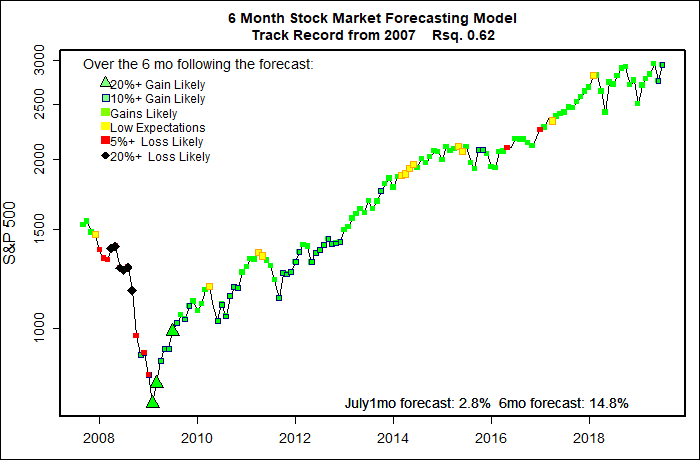
The statistical forecasting model says:
July, 2019: +2.8% (Outstanding.)
Next 6 Months: +15% (Very high!)
Probability of at least breaking even: 97% – 98% (Excellent)
What am I doing? Fully invested since spring 2009.
Last month the model was extremely positive, but I was dubious. Once again, the model was more nearly right than I. No surprise there. The model expected a one month gain of 3.5%, but the S&P 500 actually rose over 6%! Best June in decades.
The model (actually, several flavors that each view data a bit differently) remains highly positive, seeing little chance that the stock market will fall during the second half of the year. That, of course, doesn’t mean that the market cannot possibly crash. It just means that if the market does what it typically does in response to a number of economic variables, then it will do just fine. Fortunately, the market usually does what it usually does.
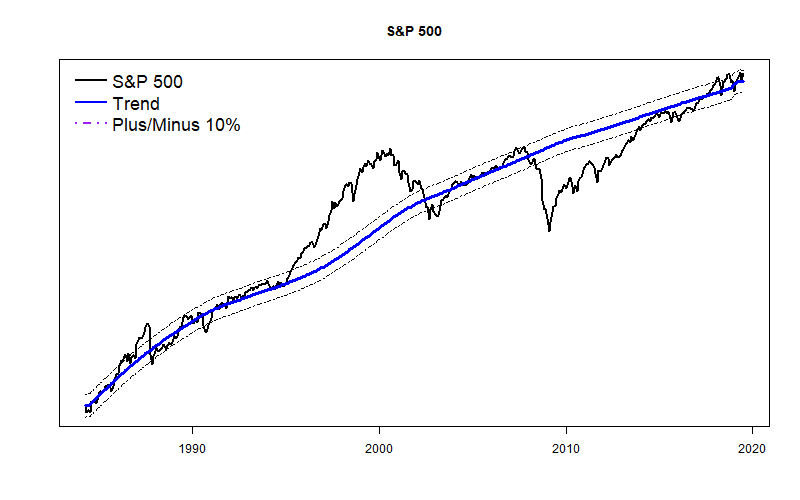
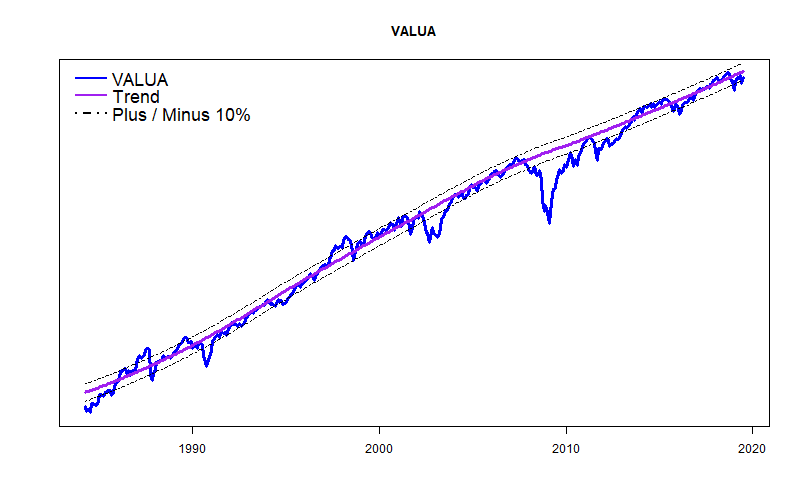
Long Term Trend Lines
Not much news here. Both the S&P 500 and the Value Line Arithmetic Average are within their normal envelopes. As a minor corroboration, the Morningstar Fair Value Graph , a favorite of mine, says the overall market is about 3% undervalued.
These are quite boring graphs, but hopefully they illustrate that the stock market is not in the middle of any wild and crazy bubble. It is just following the same basic trend it has followed for decade after decade. The one worry is that these trend lines take account of prevailing interest rates. If interest rates shoot up, stocks will certainly tumble down. That does not appear likely for months at least.