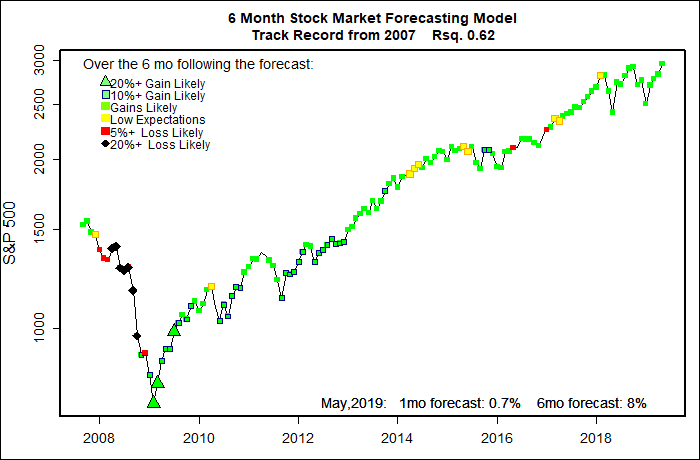
The statistical forecasting model says:
May, 2019: +0.7% (Models not very certain about May)
Next 6 Months: +6 to +8%
Probability of at least breaking even: Good to Very Good.
What am I doing? Fully invested.
The models’ forecasts for the coming half year are somewhere good but not great. The models that I have been reporting on for the last decade are mainly in the “good performance” camp. I am in the process of transitioning to updated versions of the models. These newer models have about the same view of the market.
I have no idea what is likely in the coming month, however. The several models’ forecasts for just the month of May are split. But the only time these one-month models deserve any attention anyway is when their forecasts are either very high or very low. So, ignore them. :o)
Overall, it looks like there is a good chance the stock market is heading into a “blow off top”. My personal expectation is for some volatility. Seems like time for a bit of fear to creep back in.
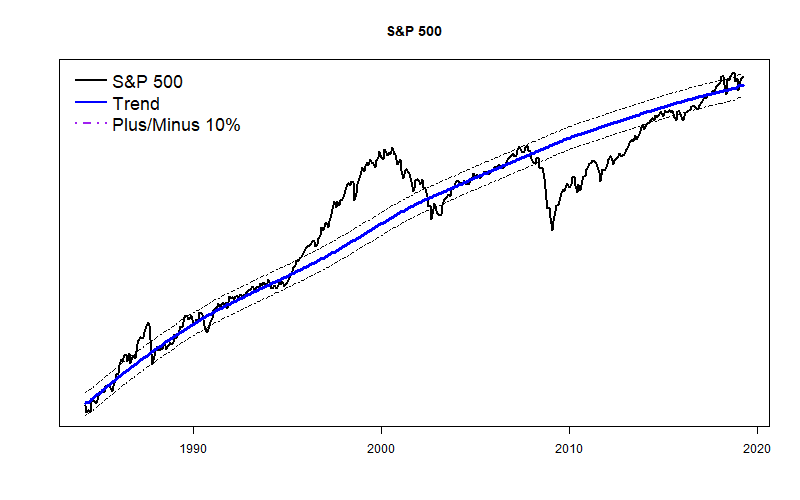
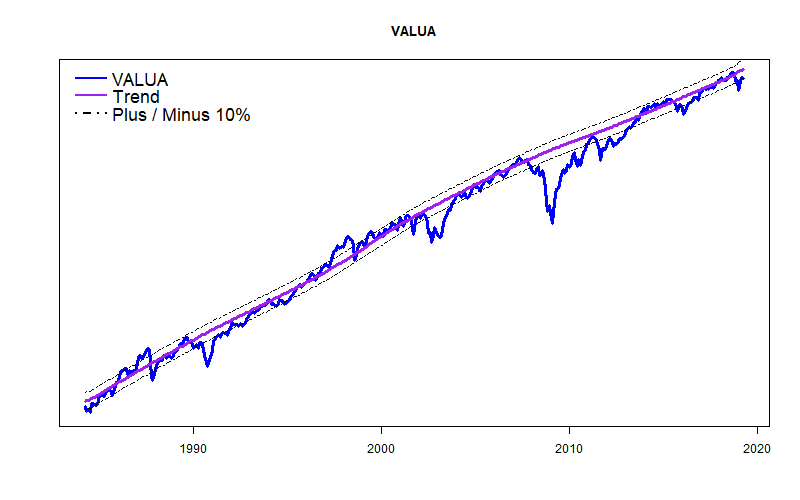
The trend lines for the S&P 500 and the Value Line Arithmetic Index together say that the stock market overall is following its very long term track based on Real Potential GDP and long term shifts in interest rates. That’s good.
But, there is a somewhat interesting nuance — the S&P 500 is near to the top of the channel while the Value Line Arithmetic is not. No big deal, but normally that means that stocks may be moving into a minor bubble.
(Click on image to enlarge.)
