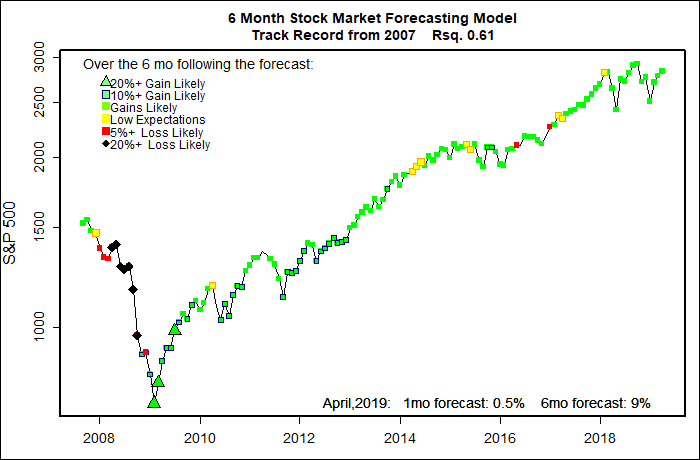
The statistical forecasting model says:
March, 2019: +0.5% (Average)
Next 6 Months: +9% (Above average)
Probability of at least breaking even: Good.
What am I doing? Fully invested.
The interest rates for 10-year Treasury Notes and 3-month Treasury Bills were the same this past week. That is usually a very bad sign of low confidence in economic growth and typically points to economic recession. But, it doesn’t mean that the stock market is going to crash right away.
If the spread between long and short term rates gets worse over the next couple of months, it will be time to worry. Current statements from the Federal Reserve are dove-ish. The Fed is not intentionally trying to slow the economy. They are willing to be very very patient in maneuvering the economy out of the historically low rates needed to end the Great Recession. (Don’t hold your breath — it could take another decade to complete the process.)
My forecasting model has become more optimistic, expecting the next 6 months to be bullish for the stock market. Me? I’m not so sure. I expect more volatility as we go through the process of treating government and the economy as some sort of reality TV show that is mainly interested in high ratings.
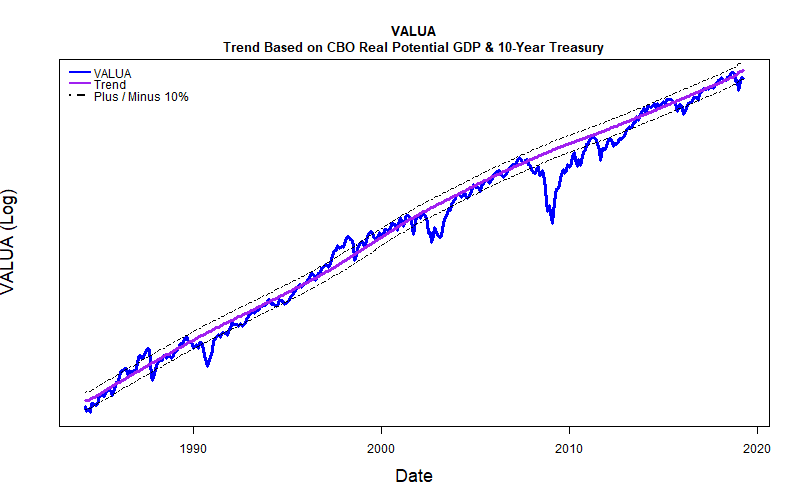
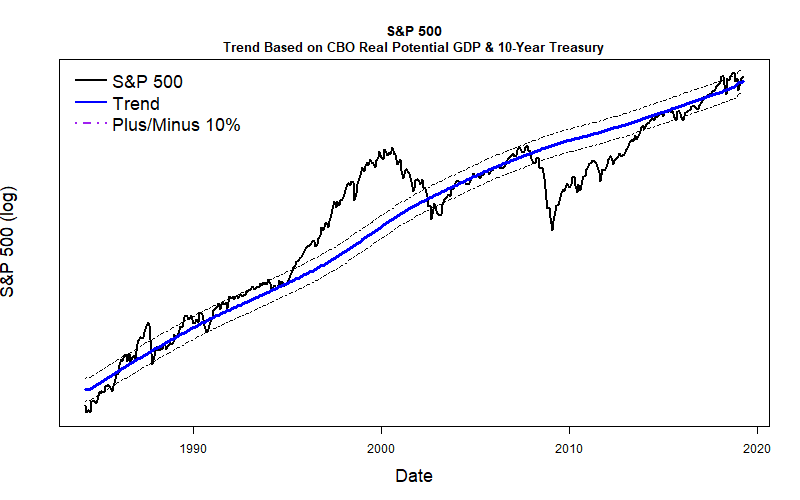
Long Term Trends
I have included graphs of long term trends for the Value Line Arithmetic Average and the S&P 500. In both cases the trend lines are based on the Congressional Budget Office Real Potential Gross Domestic Product model and smoothed data on 10-year U.S. Treasury notes. You will need to click on the images to enlarge them enough to really see much. At the moment, VALUA is slightly below trend and S&P 500 is a bit above trend. I wouldn’t read too much into these differences. The whole purpose of these long term trend lines is to see if the market is grossly above or below their long term trends. Right now, both appear to be fairly close. No big bubble.
Well, actually that isn’t quite true. Over the long haul the broad-based VALUA has performed distinctly better than the S&P 500. But, when investors are enthusiastic the S&P will shoot up faster. We are seeing a bit of that now.