What the forecasting model says:
One Month Stock Market Forecast June, 2018: -0.1% ( below average)
6 Month Stock Market Forecast May thru October, 2018: 3% (slightly below average)
Probability of at least breaking even: 0.57 to 0.94 (Surprisingly high)
What am I doing? Staying fully invested, still thinking the March – April downturn was healthy, and last month’s rebound was normal.
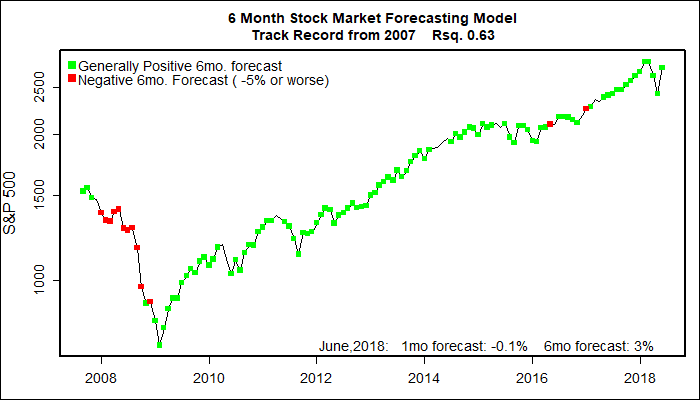
The current one-month forecast is slightly negative at -0.1%. That is no big deal as the one-month forecast is not all that accurate anyway. I only pay attention if it forecasts a one-month drop of over 1% — not usual and a definite bad sign. Most likely the model is just showing a small bias against market performance during the May to November period. Same story for the 6 month forecast of a 3% gain — slightly below normal.
Unlike my model, I personally expect to see extra volatility over the next half year due to the mid-term congressional elections. Come the first week of November I think it is highly likely that about half of U.S. voters will be upset with the outcome. Before that there is a very good chance that even more than half of the U.S. population plus foreign investors will be anxious.
To me, that is a scenario of market volatility.
But, my soul-less, nonpartisan mathematical model is right about the next market moves much more often than my personal expectations. That’s why I built the model, after all.
