Why pay any attention to the stock market forecasts from this forecasting model? It looks like a buy/sell strategy may significantly boost investing returns.
In my last post I introduced a stock market trading strategy based on my 6 month market forecasts. It turns out that the forecasts consistently lead the market by a couple of months, so actual trading works best not by following the most current forecast, but by using a lagged forecast that weights forecasts from a few prior months. The buy/sell periods called by that strategy are shown in the plot at the end of this piece. That plot shows the strategy produced just a handful of handful of buy/sell points in the period since mid-2007 when I started posting forecasts for my models.
So what? A few correct buy/sell decisions can have a huge impact on investing returns. In particular, the forecasts of 2008 through early 2009 screamed of likely 6 month market losses of 17% or more, months before the crash took place. They turned out to be right. They were worth paying attention to.
A back-test applying the buy/sell strategy to an S&P 500 index fund is shown below running from mid-2007 to the present. In the stock crash of 2007-2009 the S&P 500 took a big hit, but overall for the period the average has had a 4% annualized rate of growth. The strategy using the 6 month stock market forecasts, however, had an annualized growth rate of 14%, roughly 3 times better.

The big market call of major likely declines made for most of the difference in performance. Since the bottom of the financial meltdown the strategy has had only a few brief sell periods. So, for mid 2009 to the present the S&P 500 index has had a great rise and has only slightly under-performed the strategy.
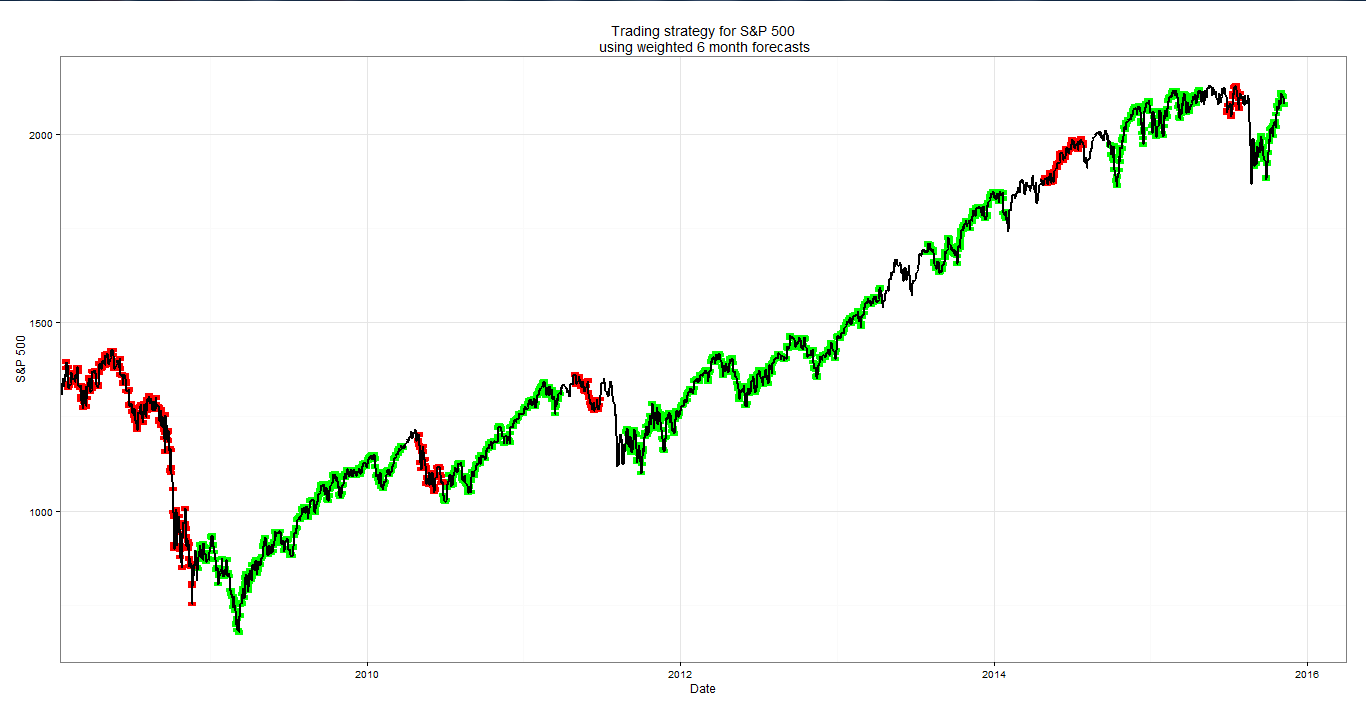
The chart below shows the buy/sell calls produced by a strategy based on using a weighted average of 6-month market forecasts.